
Bond bulls: it's so over!
Not one, not two, not three, but four bearish duration news yesterday! Time to reassess the trade

A couple of weeks ago, I dove headfirst into the long bond trade, betting big on what looked to me the most hated trade. If you missed it, catch up on that entry point here:

Fast forward to now, the timing was not great, and to add insult to injury, not one but four pieces of bearish news hit the tape yesterday. Let’s break it down and see if it’s time to hold or fold.
Yesterday was a “quadruple whammy” for the bond bulls 🔪🩸💀⚰️:
All ISM services surveys (index, prices paid, new orders, employment) came in above expectations.
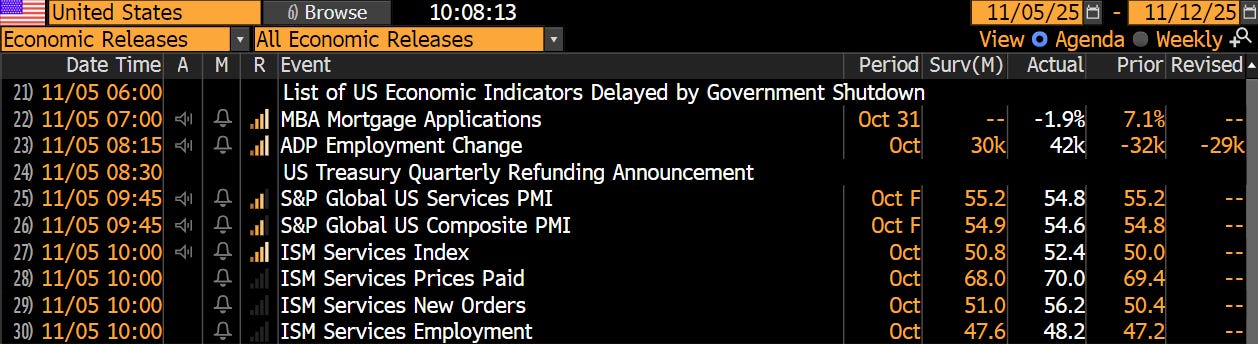
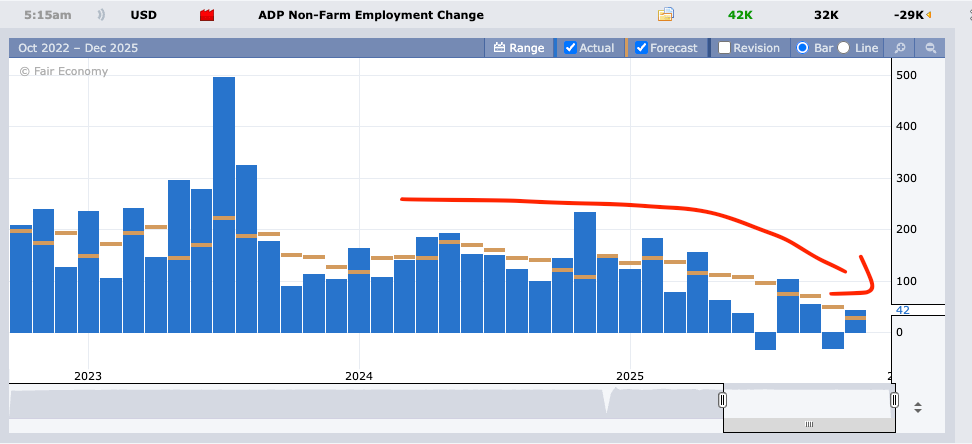
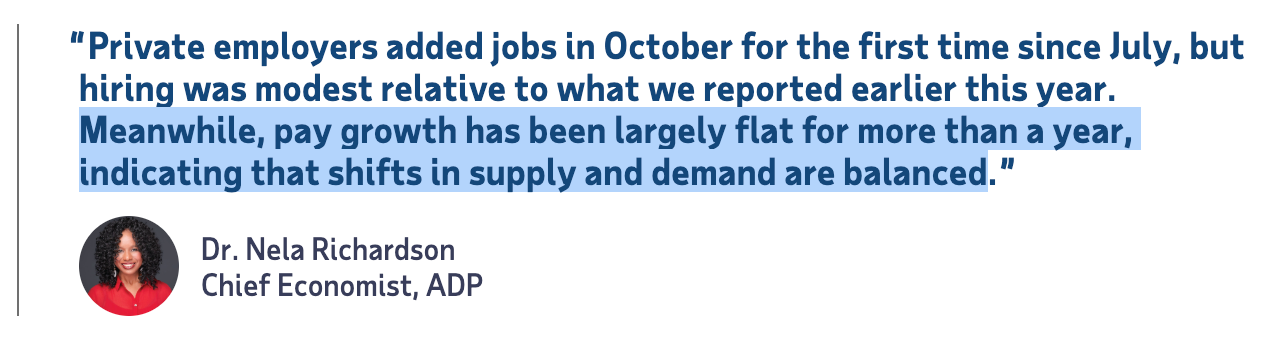
ADP Employment Change added 42k jobs instead of the expected 30k.
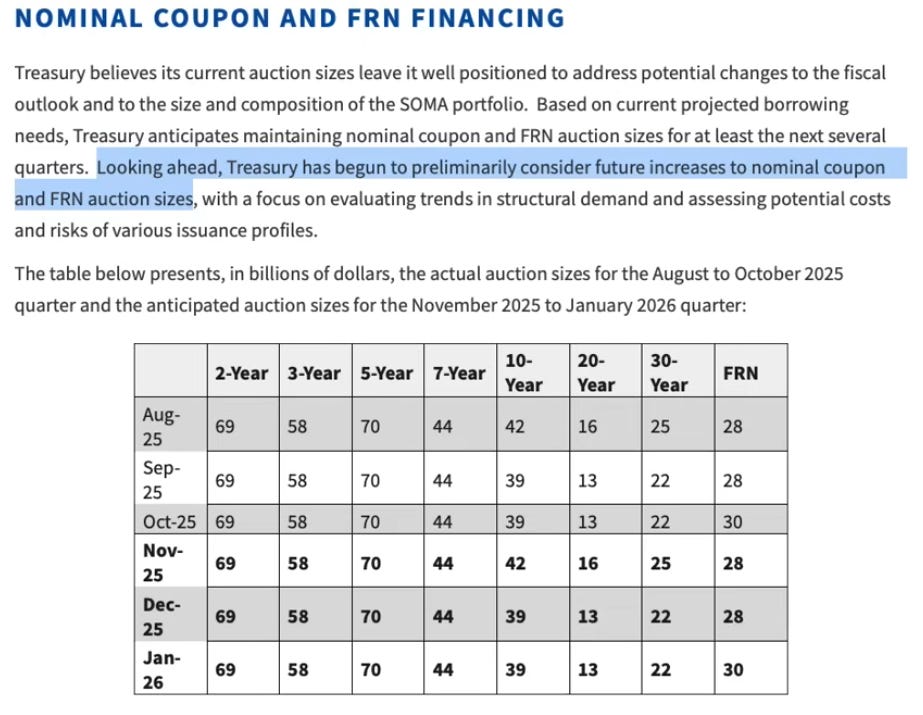
The Treasury QRA met expectations, however, the guidance was toward more issuance of long-term debt: “Looking ahead, Treasury has begun to preliminarily consider future increases to nominal coupon and FRN auction sizes”

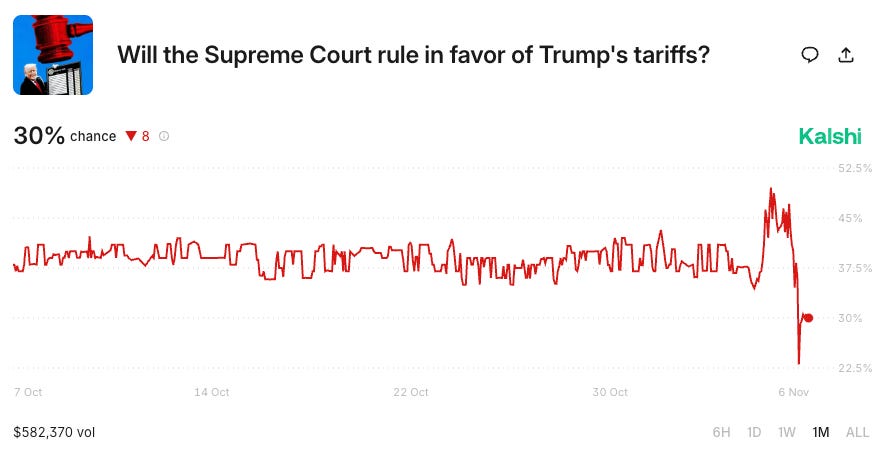
The market is repricing lower the probability of SCOTUS ruling in favor of Trump’s tariffs. A large refund of tariffs would be a hit to the US debt-to-GDP, adding more pressure to yields. This is a big deal; refunding the tariffs is one thing that the market can absorb easily, but the lack of tariff revenues over the next few years will mean the fiscal impulse will switch from negative to positive.


These four pieces of news repriced the entire US yield curve higher; no tenors were safe. And my portfolio NAV has repriced much lower because of my overweight in bonds. After 2 weeks of leaking money, we need to review the trade.
This is what the macro is telling me:
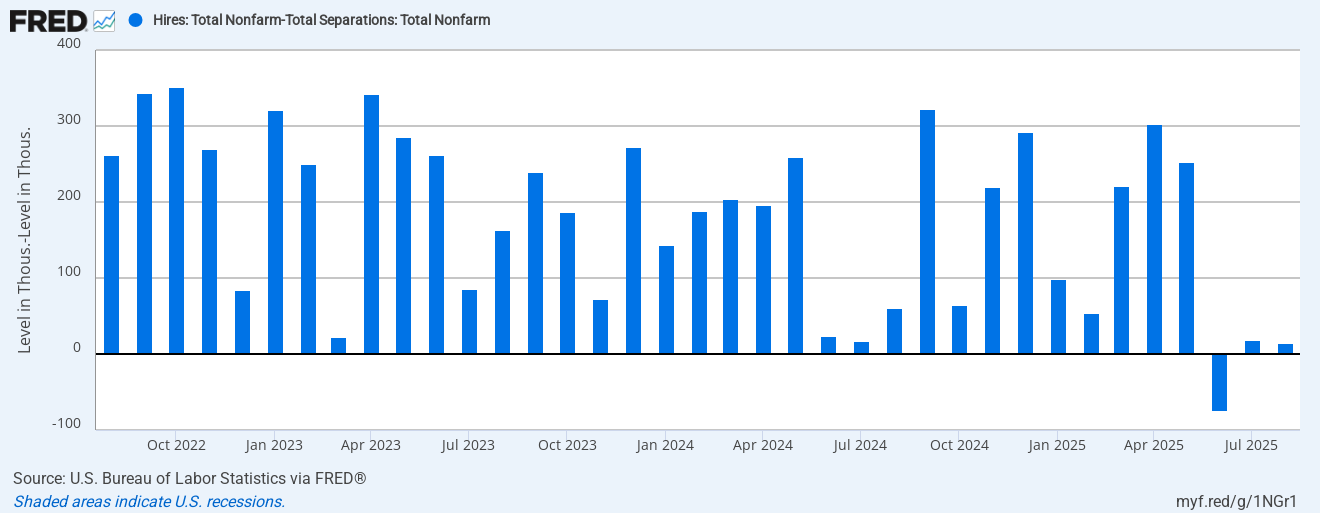
Job Market is transitioning from tight to loose: The JOLT data from August were indicating a job market at a perfect equilibrium: the number of hirings is meeting the number of firings.

What helped this market from deteriorating outright is the large decline in immigration since Trump took office. Less immigration equals a decrease in the total labor force; this change helped to finally match the demand of labor (red line) with the supply of labor (blue line):
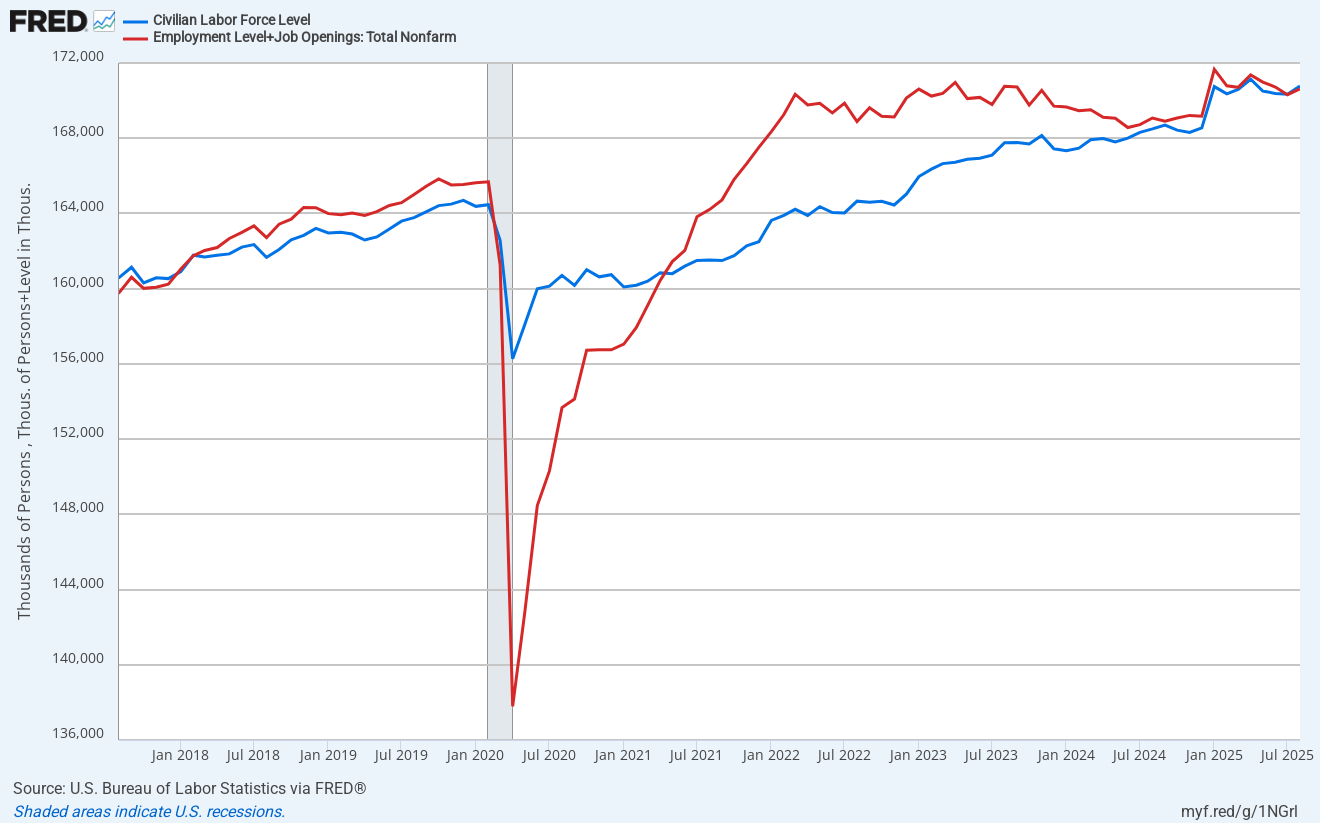
Again, this data is from August and we are still flying blind during this government shutdown. However, the trend has been clear: we went from a tight job market to a loose one, and I am not expecting this trend to have changed since August. Despite the expectation beat in ADP employment change, and the uptick from August, the trend is still lower.
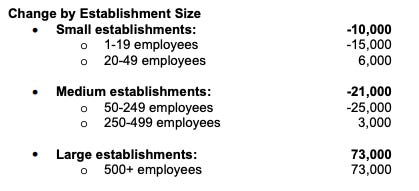
A K-shaped economy also means a K-shaped job market. The bulk of the growth has been coming from the large companies; this has been true for this September report as well:
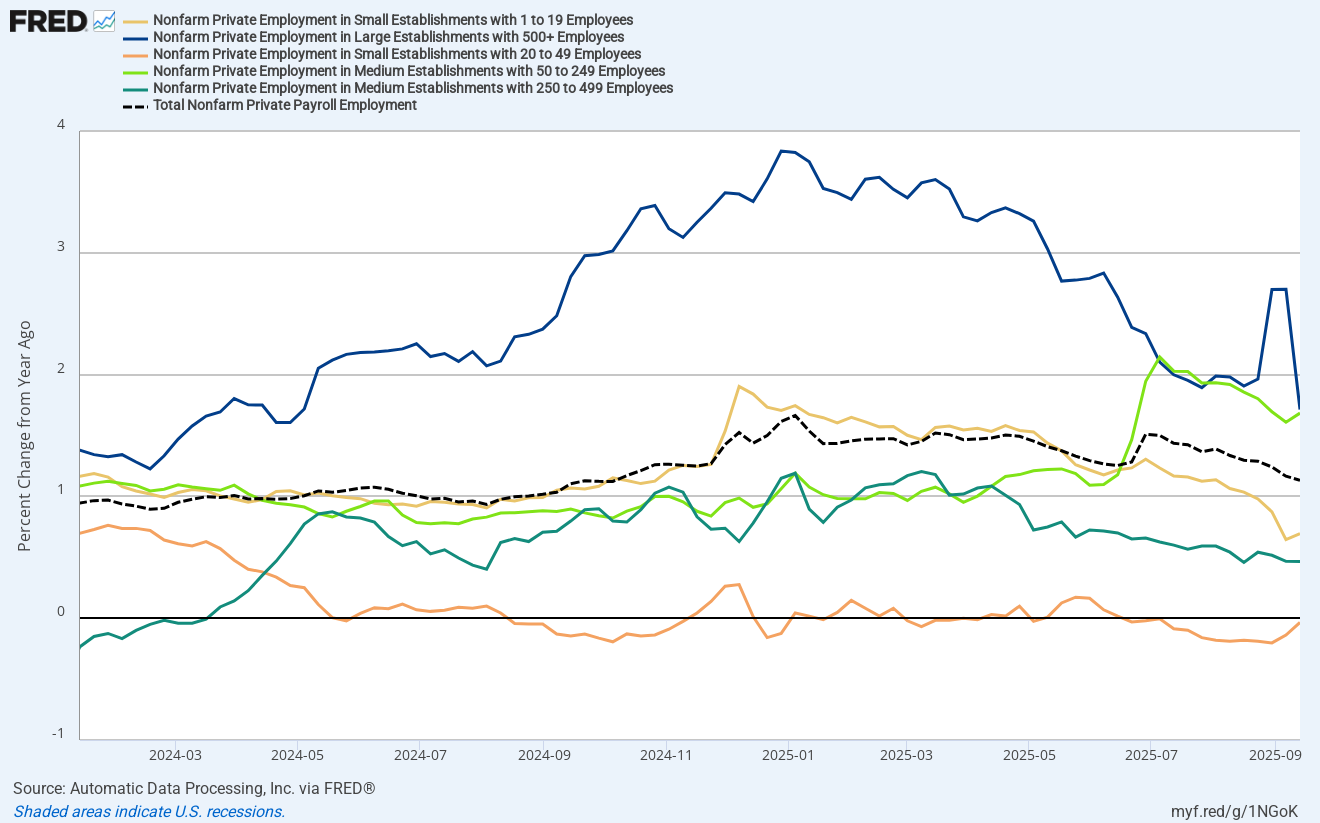
This is particularly striking when splitting the ADP data by company sizes and looking at the rolling yearly percentage growth. The bout of growth in 2024 has been driven by large establishments with 500+ employees. But ever since January of this year, the rate of change has been continuously decreasing.
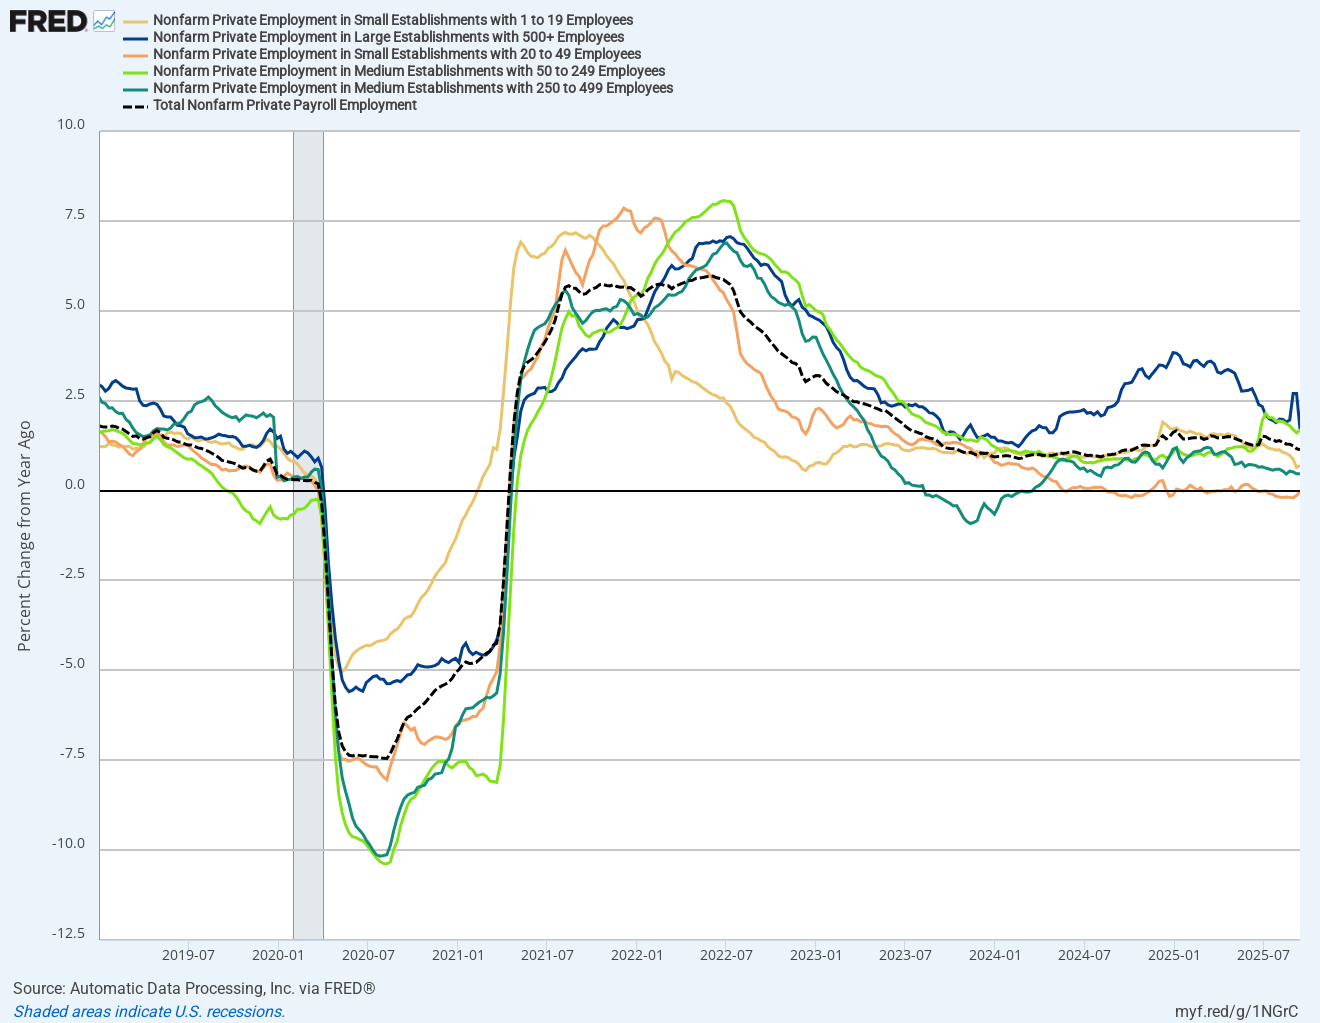
Zooming in a bit:

The AI revolution has built a narrative around layoffs. The common perception is that companies are letting their employees go not because of a slowdown in the business, but due to an increase in productivity. The below video from CNBC is particularly interesting, as it debunks this myth:
There’s no doubt AI is a powerful force in the economy right now. The extent to which we think it’s affecting the economy and hiring is in entry-level, low-skilled jobs.
We haven’t been able to find yet much evidence that AI is capable, at this moment, of taking over sort of white-collar middle management jobs.
So why are we seeing so many layoffs and how much of it is because of AI?
Wall Street has been hyping generative AI innovation for several years now, which is putting pressure on executives to make it a part of their business model. 79% of CEOs in the US said they feared they could lose their jobs within two years if they didn’t deliver measurable, AI-driven business gains.
Investors need to be a little careful with what some people have called AI washing. And what that is, is this idea that because business is deteriorating or there’s some difficulty going on with the business, you say, oh, we’re letting people go because of AI. No, you’re letting people go because the business is hurting and calling it AI, and because Wall Street is buying anything with the letters “A” and “I” attached to it. And so what you might find is you would actually get a bump in your stock because you’re letting people gobecause of AI.
Companies are laying off not because of AI, but because the business is not growing as much as they want it to. At the same time, investors have been convinced we are about to see a jump in margins over the next year while nominal GDP is already running very high. Why would you own any bonds and not be fully invested in stocks if you believe this narrative?
A job market at equilibrium means wage growth is flat. The ADP release confirms this dynamic again.
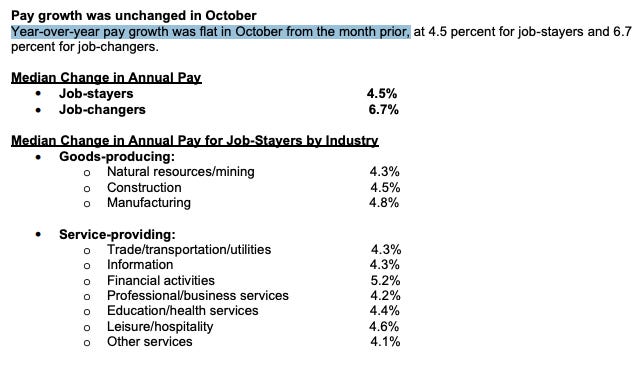

The inflationary tail risk is non-existent. If wage growth is flat then shelter inflation is flat too. Add on top of that a front oil future pricing below $60 and you get a very inoffensive inflation cocktail.
Last but not least, Trump still wants lower rates. And what Trump wants, he usually gets. The Fed will cut in December.


I’ve made some expensive mistakes in the past, one of them being to go full macro. Sometimes the macro thesis looks so clear and straightforward, but the trade turns into a disaster. Always check that prices and charts confirm the macro thesis, rather than going against it. Similarly, a chart might look good, but if the trade it suggests opposes our macro view, we never take it.
Never go full macro, but never go against your macro. ~Market Hitchhiker
Let’s review the chart and what the market is pricing:
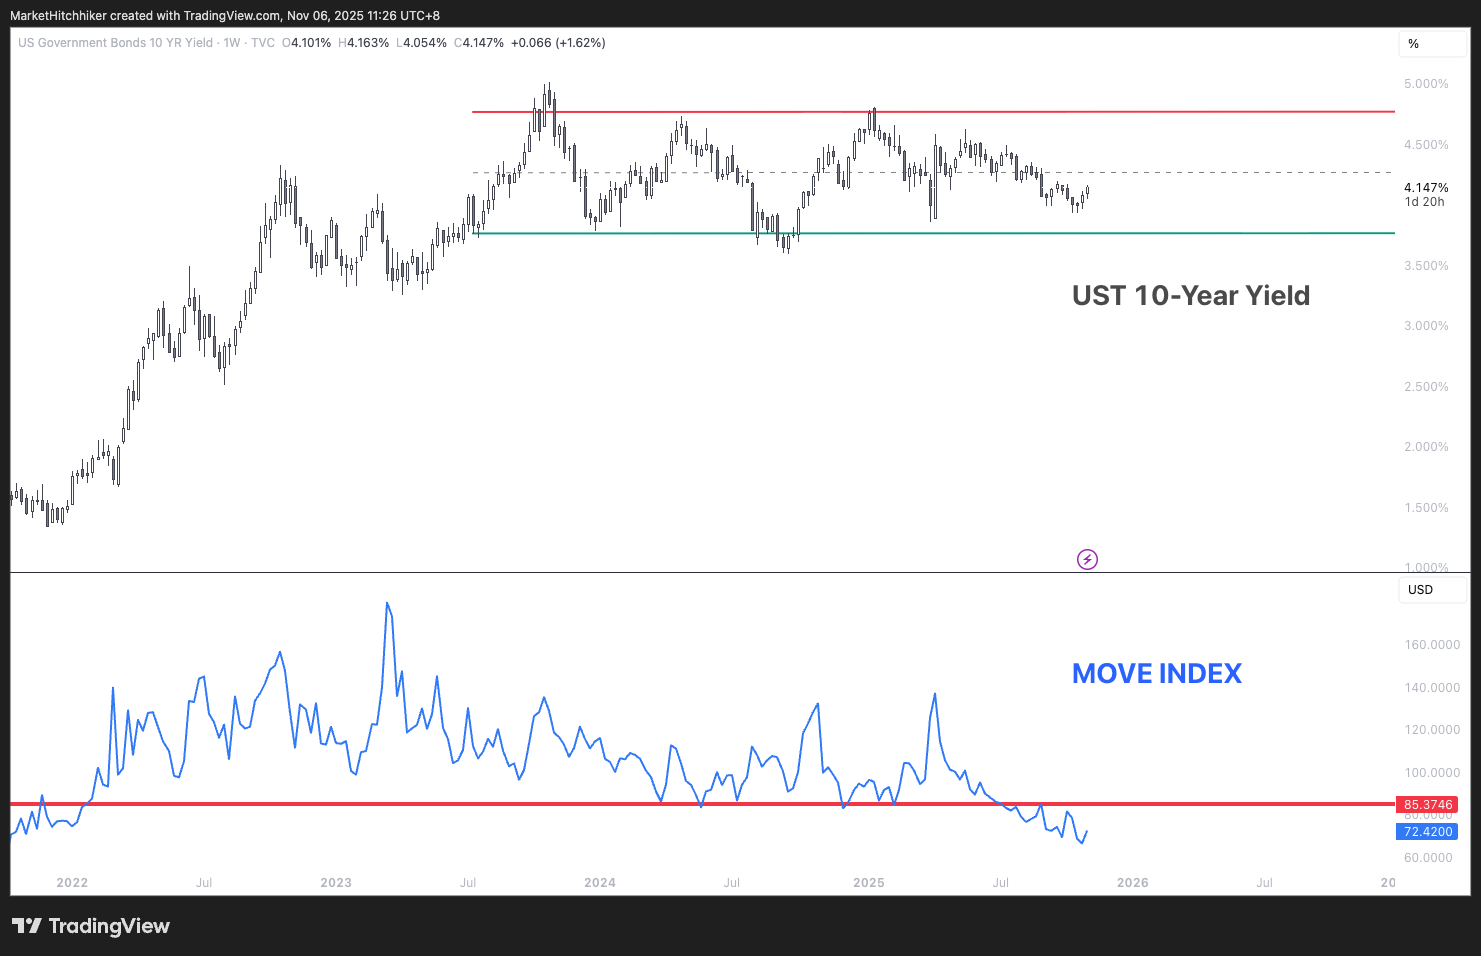
Long term weekly chart:
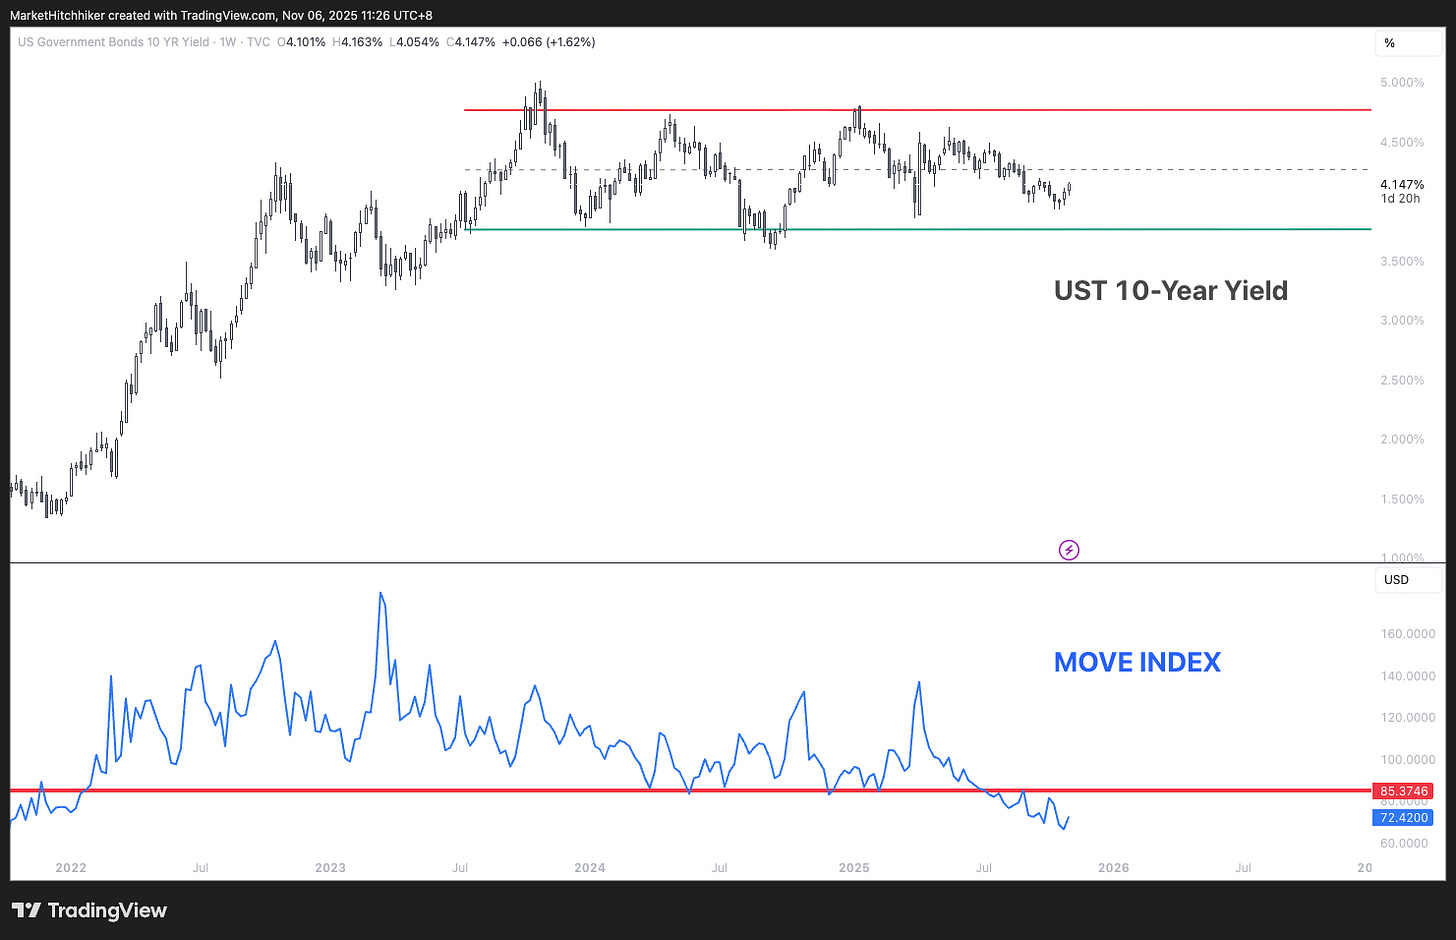
The UST 10-Year Yield has been trading for the past two years in a range of [3.75% ; 4.75%]. We are currently trading slightly below the middle of that range. From a pure technical perspective, the yield is stuck in a mean reversion process and it could go either way. What I find more interesting is the MOVE Index breaking lower; it has finally exited the range above 85% which has been the lower bound established after the great bond bear market started after Covid. It confirms my intuition that the inflationary tail risk has disappeared. This could come as a shocker for a few of you; one of the popular opinions is that the only thing that could derail this stock market is a burst in inflation. After all, every stock market bubble got popped either by an inflationary boom or bust. And given the current state of affairs (fiscal dominance), the natural way for this market to evolve would be for energy prices to rise and for inflation to follow. Well, as long as the MOVE Index is trading in a downtrend, I will push back against this view.
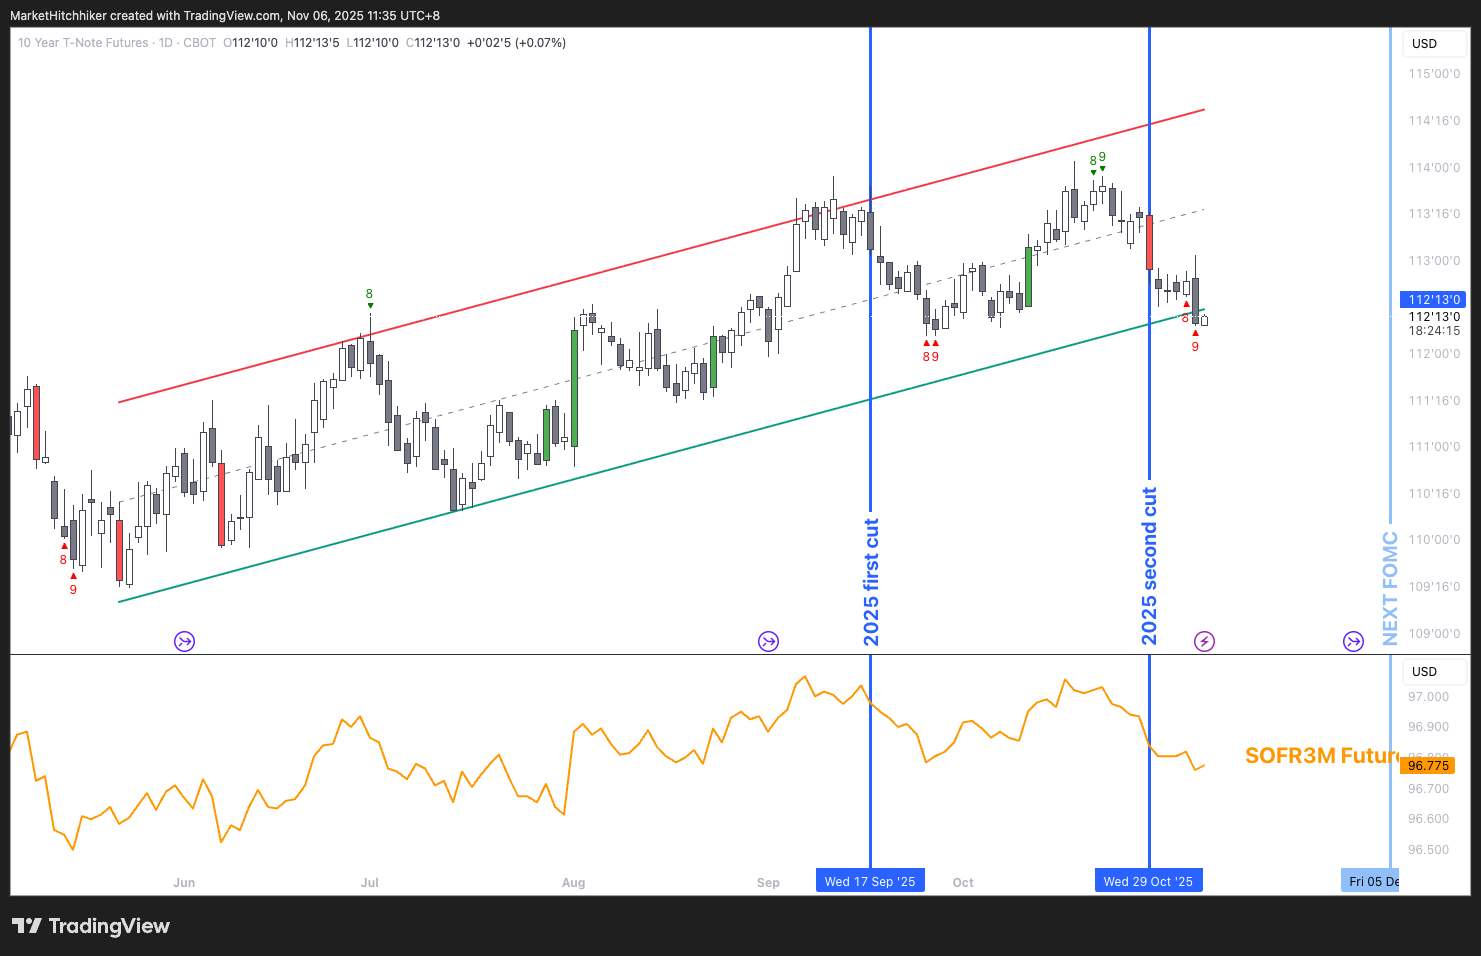
Short term daily chart, using ZN bond future:
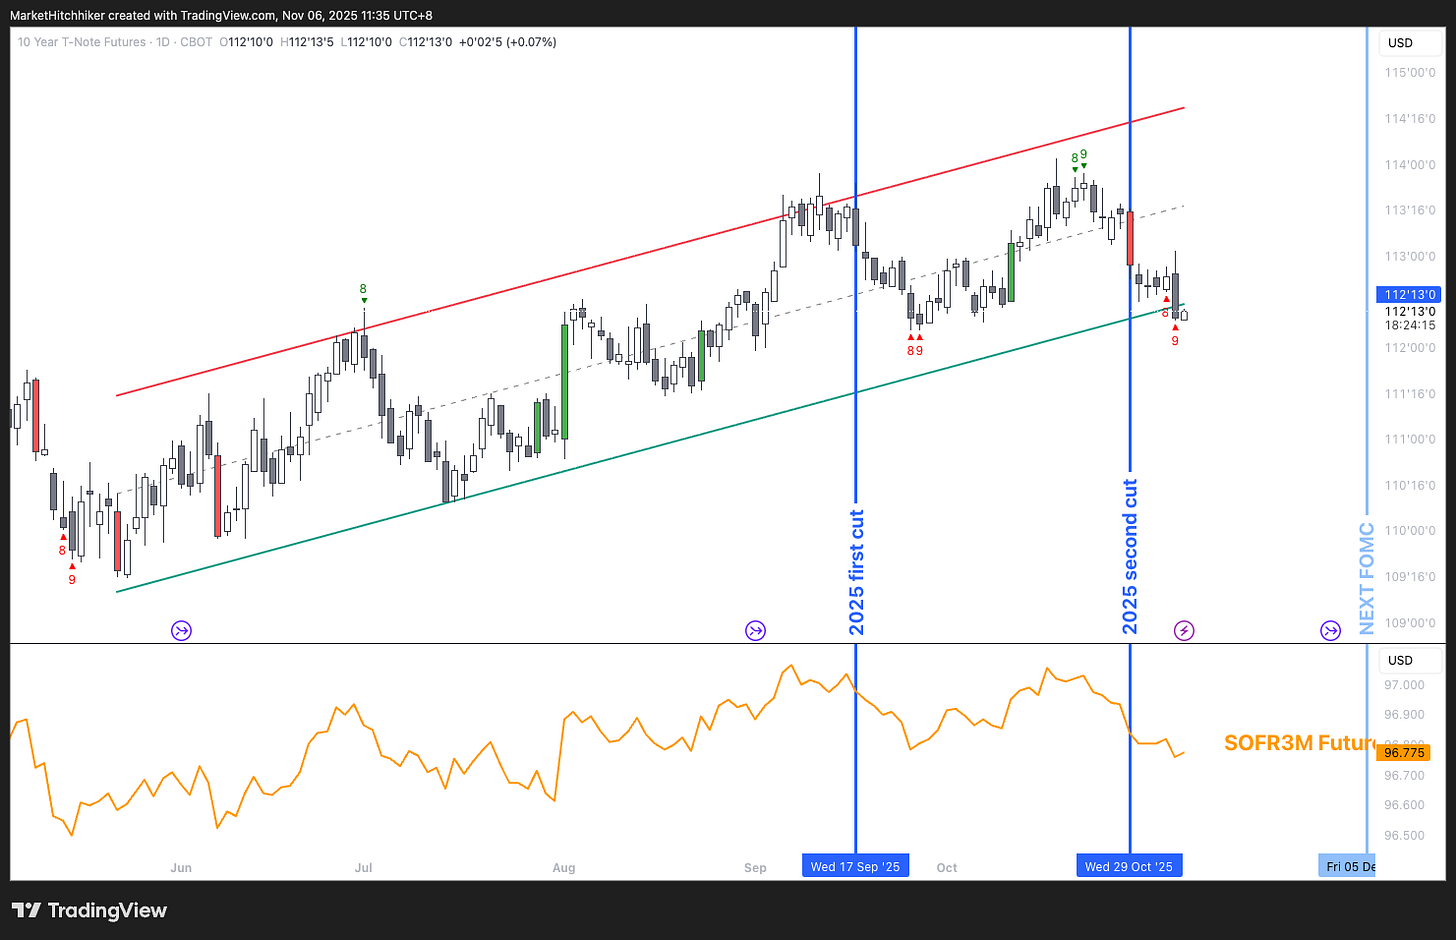
Over the last year, the ZN has been in a clear uptrend. The last price is now sitting at the bottom of the regression channel. That line is obviously made up, but a regression channel is a lesser evil than an arbitrary trend line drawn by yours truly. At least there is some sort of statistical truth in that channel: the trend is up and now the price is sitting at 2 standard deviations lower. It is time to decide your side: are you still a bull, or is it time to fold? The lower panel is the SOFR 3Months future expiry September 2026. I chose this expiry because it captures the bulk of the coming rate cuts

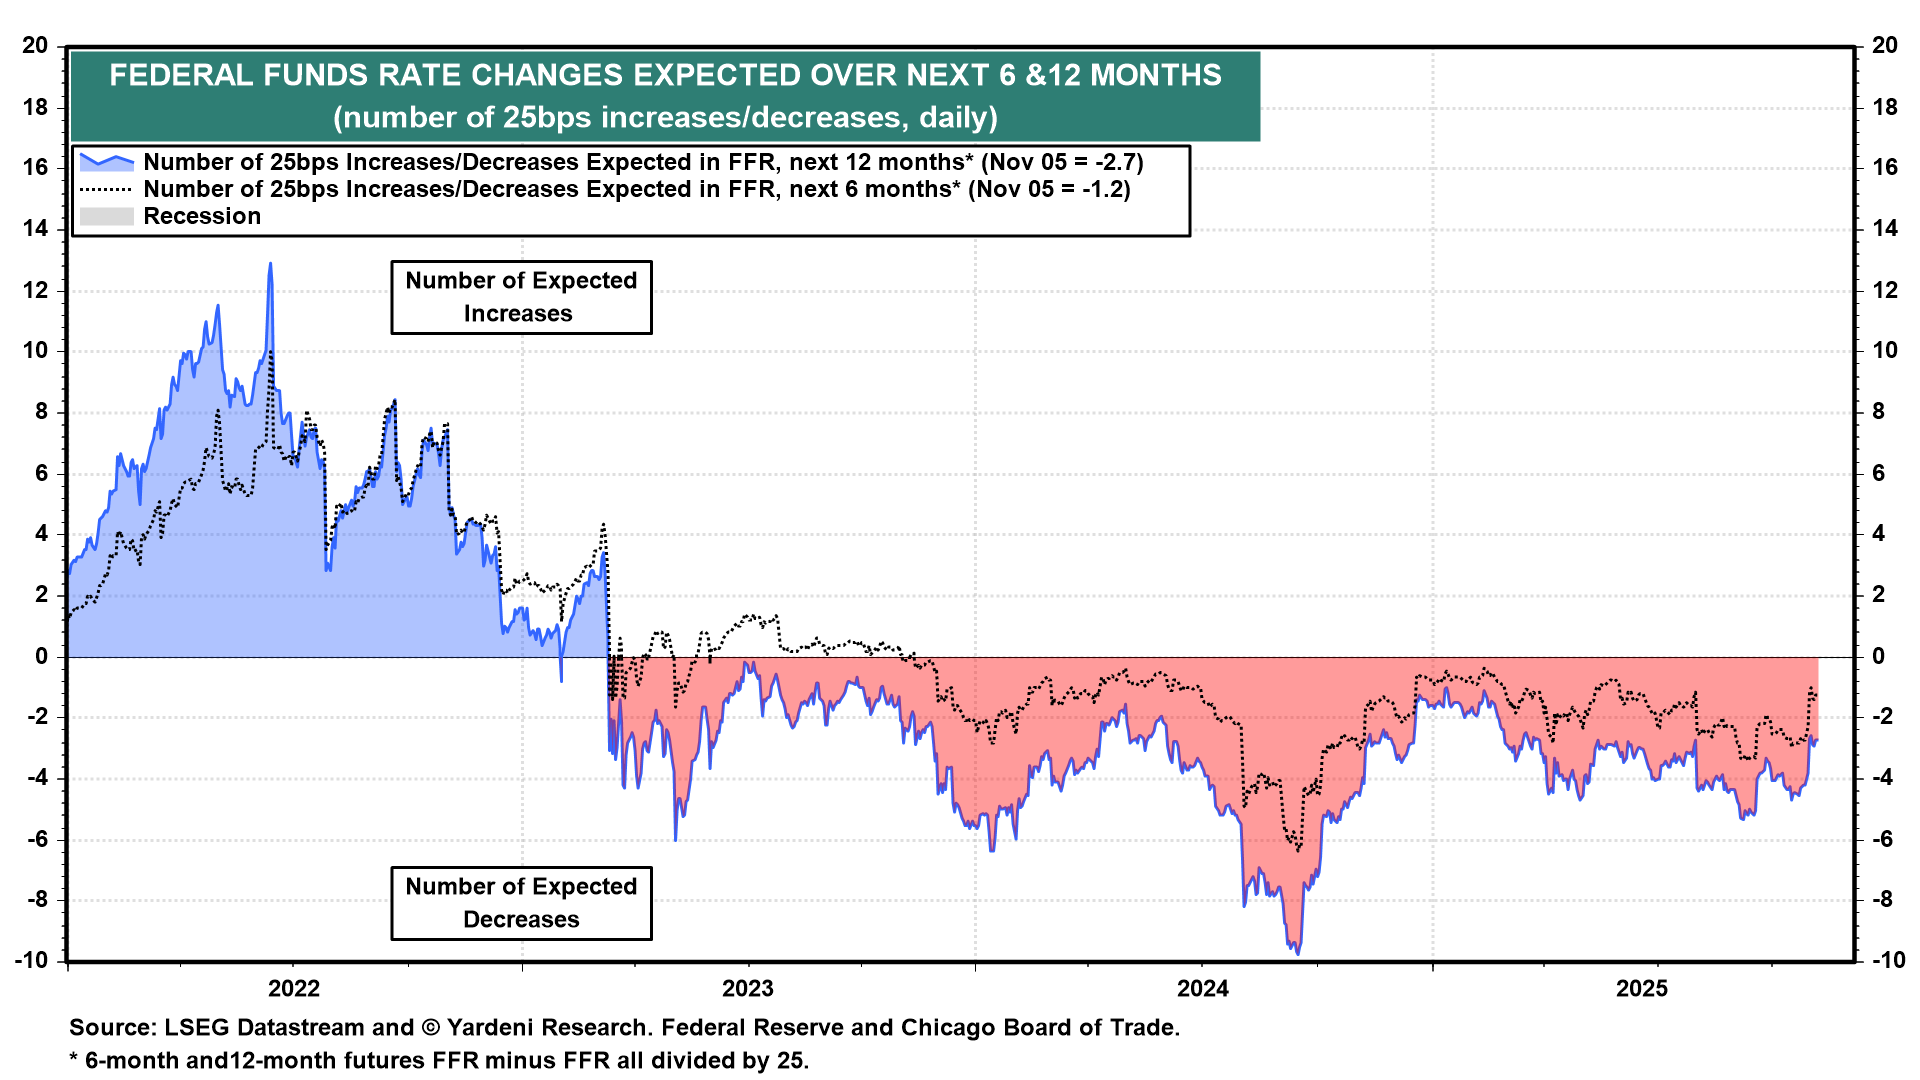
This SOFR future is also sitting near the previous low in October. If I want to be long outright ZN, I also want to be somewhat bullish on this SOFR future. Yes term premia will impact ZN, but the bulk of the move will come from the front end of the yield curve. I still like my odds on the SOFR future; it is sitting at support and we don’t price many cuts anymore. Over the next 6 months, we are pricing only 1.2 cuts, that’s very hawkish!

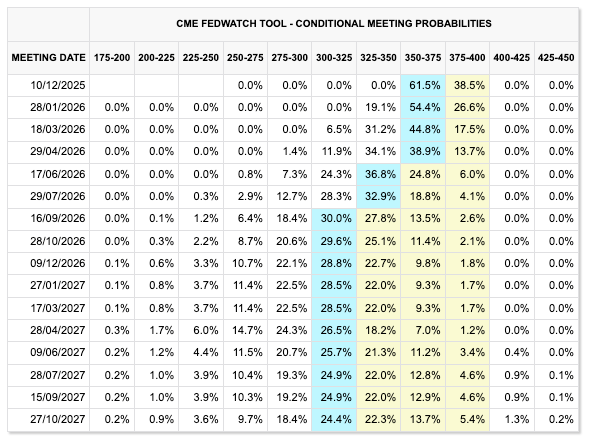
Doing a bit of behavioral analysis, I think what happened is that market participants got freaked out by Jerome Powell during the last FOMC. They went from 99% probability of a cut in December, to only 60% and pricing out even more cuts in the future.
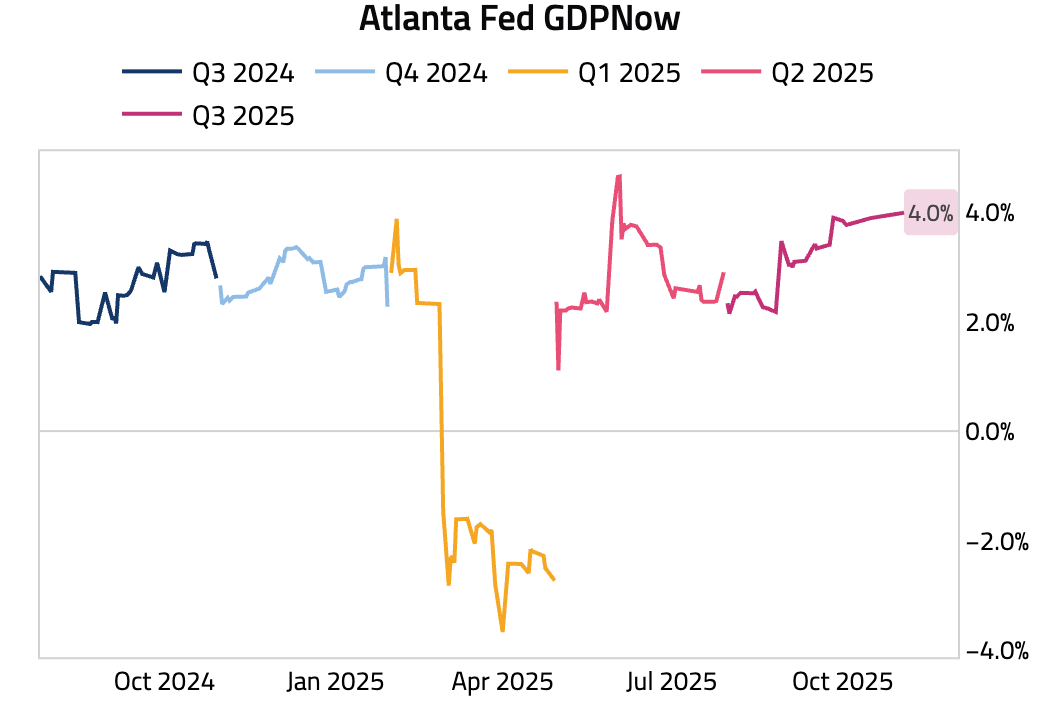
The US Government shutdown has not been helping either; we have no data and the widely used Atlanta Fed GDPNow is now clocking at +4.0%, this looks extremely optimistic to me. There is a high chance this variable renormalizes a bit before the end of the year; that should mechanically reprice the yields lower.
In conclusion I am not stopping myself out of the long bond trade. If I had no position, I would be adding now. With an hawkish Powell, SCOTUS on tariffs, the QRA and GDPNowcast at 4%, the trade looks absolutely scary. But more often than not, the scariest trades are the best.
Best of luck,
Market Hitchhiker
Fully agree - keeping my bond and SOFR positions as well.
Regarding macro thesis vs price action: if i understand you correctly you develop your own macro thesis based on macro data and then take a trade if your thesis is confirmed by price action (and maybe if positioning creates opportunity).
I was just reading about a framework that chooses the „right“ macro thesis based on which macro narrative is the best fit to explain current price action across multiple assets (simplified example: choosing the „global fiscal expansion/reflation narrative“ if commodities & gold rally) and then just runs with this narrative until price doesn’t confirm it any longer.
Would you say the latter approach relies too much on price action? Thanks!