
The Hitchhiker's Guide to Positioning: Part I
Discretionary Investors — It Takes Three to Tango

Imagine spotting the early signs of a market cascade before it unfolds, volatility spikes triggering systematic sell-offs that amplify downturns across the board, from hedge funds to retail traders. In today’s $50 trillion US equities landscape, understanding positioning isn’t just insightful; it’s essential for anticipating those moves and staying ahead.
After a decade of trading, I believe to my core that the trifecta of price, positioning, and sentiment is an endless source of alpha. This edge can’t be arbitraged away because it’s rooted in one simple truth: market participants, while somewhat rational, are perpetual victims of the never-ending cycle of fear and greed.
This primer on positioning will help you understand the crowds behind market-moving flows and their respective reaction functions, enabling you to better read the market. A clear picture of positioning, combined with a deep understanding of each actor’s reaction function, will give you an edge.
After reading this guide, you will be able to answer these key questions:
Actors: Who is long and short?
Crowdedness: On aggregate, is the market crowded?
Forecasting: For each market scenario, based on each actor’s reaction function, who is the marginal buyer or seller?
Decision-making: Should I follow the crowd (trend following) or go against it (mean reversion)?
It is a very dense topic, with many different actors and intertwined dynamics. This primer will be divided into several parts. In Part I, we’ll dive into one major segment of the key market actors: the discretionary investors.
Subscribe to the Substack to stay updated for Part II and beyond.
Table of Contents
Part I — Discretionary Investors
Introduction
Overview of Key Market Actors
“Alpha Hunters”: Hedge Funds
“Beta Compounders”: Pensions, Endowments, Family Offices and Sovereign Wealth Funds
“The Wild Card”: Retail Investors
Conclusion
Introduction
How can we talk about positioning without starting with the rise of passive flows? Over the past decade, passive investing has absolutely crushed active strategies in terms of AUM growth, ballooning from $4.2 trillion in 2015 to a whopping $18 trillion by August 2025. That’s a 329% surge fueled by relentless inflows totaling $5.8 trillion, while active funds limped along with just 76% growth to $16.9 trillion amid $2.5 trillion in outflows. This shift has flipped the script on market share, with passive claiming over 50% by 2023 and holding steady.

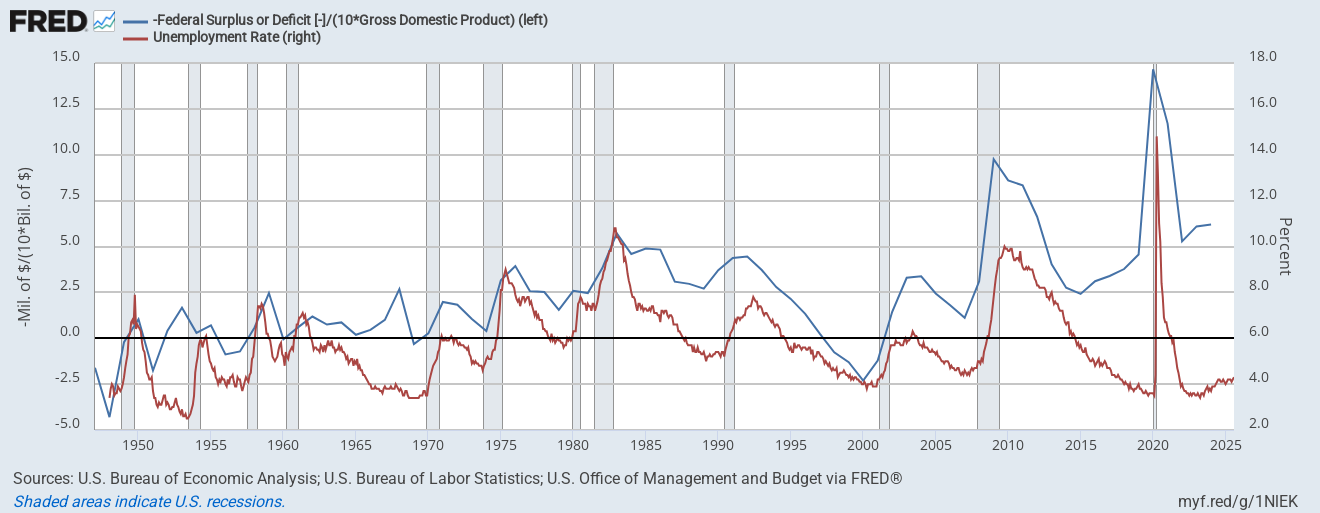
Passive flows, by definition, have no sensitivity to price or value. This represents an inelastic demand, providing a perpetual bid to the market. While no positioning analysis is needed here (it’s always going up!), we cannot simply dismiss it. Even when the market reaches unbelievable price levels (both up and down), the passive crowd will keep pouring money in—unless, God forbid, unemployment starts to rise significantly, putting an end to 401(k) inflows. This is an extreme tail-risk scenario and technically unlikely, given the U.S. government’s historic deficits and historically low unemployment. The secular trends include fiscal dominance, technology, and demographics. The secular risk is debasement—and with gold above $4,000, everyone knows it. Therefore, our strong hypothesis is that the rise of passive investing will not stop anytime soon, and the long-term positive drift in valuation ratios like P/E is a byproduct of this dynamic. In mathematical terms, we assume that positioning from passive inflows follows a deterministic process with positive drift and zero volatility.
Positioning analysis focuses solely on active flows, which remain a very large part of the market and a tremendous source of alpha for traders. Passive flows represent inelastic demand, while active flows are highly elastic. They follow a reaction function where spot price, volatility, and volumes serve as inputs. As a rule of thumb, higher market volatility leads to higher positioning volatility—they go hand in hand in a reflexive loop.
Overview of Key Market Actors
A discretionary investor relies on human judgment, expertise, and qualitative analysis to make investment decisions. This approach is often described as “art meets science” because it involves interpreting a wide array of information through the lens of experience and intuition.
These investors are very flexible and adaptive. They track a bunch of factors like macroeconomic trends, company fundamentals, market sentiment, geopolitical events, and even anecdotal insights.
While this flexibility can be a strength and allow them to capitalize on market opportunities, it is also a double-edged sword. Indeed, they are prone to behavioral biases like overconfidence, recency bias, or emotional swings.
The two charts below from DB give us some key insights into their behavior.
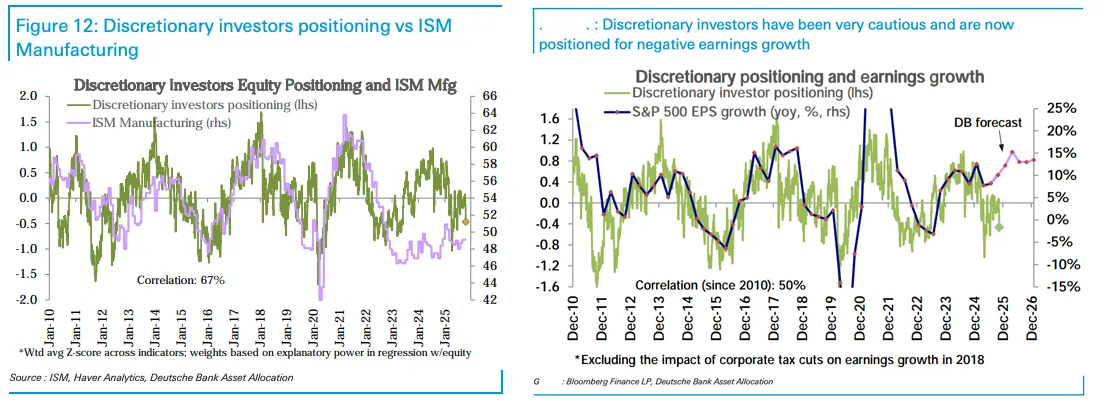
First, they know what they are doing! Their positioning has been leading the ISM and the EPS growth. In 2023, despite the false signals from the ISM, the discretionary crowd turned bullish when the Fed stopped tightening and liquidity came back. Their positioning is also closely following earnings. On aggregate, this cohort of investor is getting the big picture right. You cannot just blindly fade them, actually most of the time you want to follow their positioning. However, they are still victims of the cycle of fear and greed: they will push their positioning too much around cycle turns. They are a good fade at the extreme, not before.
The discretionary crowd can be broadly separated into three groups: “Alpha Hunters”, “Beta Compounders” and Retail Investors.
Alpha Hunters: Hedge Funds
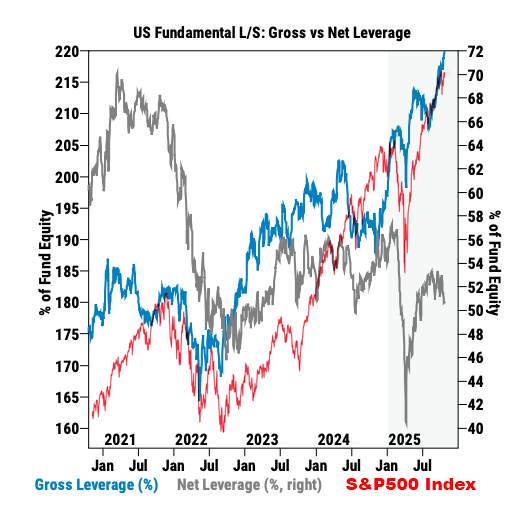
Hedge funds are absolute return-oriented. They seek performance with 0 to little correlation to the market. To reach this goal, they make use of long and short exposures. To magnify their gains (unfortunately also their losses), they use leverage. The key leverage ratios to follow are gross leverage and net leverage. Gross leverage measures total exposure (longs plus shorts) relative to net assets, e.g., 200% indicates 2x overall magnification of outcomes. Net leverage subtracts shorts from longs divided by net assets, typically 50-100% in L/S, reflecting directional exposure.
They are alpha hunters because they are incentivized by performance fees. They are not paid to sit on their hands. This is the most active cohort among the discretionary investors; positioning data is noisy because of them.
Portfolio managers (PMs) tend to be brilliant people. They are typically hired for their skills and their sheer ability to make money. This also comes at a cost: they are greedy and will push the leverage too high when they become overconfident, typically after a long stretch of good trades.
Hedge funds account for approximately 25-30% of daily U.S. equity trading volume, with flows exerting significant influence especially in some segments of the market like sectors and factors.
A factor is a persistent driver of returns for a stock. It can be value (low valuations), momentum (recent outperformers), size (small caps), quality (stable earnings), low volatility. A factor can be anything really, as long as you can measure it in a standard fashion across your universe of stocks. An L/S fund will typically screen and rank stocks quantitatively, going long on those with strong factor exposure and short on weak ones to isolate premia while hedging market risk. They are very sensitive to regime shifts and crowding.
An important clarification: Factor is not alpha. A factor represents a broad, systematic risk exposure—like size or value—that drives returns across assets, differing from alpha (the unique, unexplained outperformance due to skill or luck) and from market beta (which solely measures sensitivity to overall market movements).
Hedge funds have a unique reaction function because they are subject to very strict risk management rules: stop losses are tight, portfolio volatility is targeted, and they have a risk manager who can ask them to liquidate an entire portfolio overnight.
To study their reaction function—the most advanced one among all the actors—we will look at regime shifts:
From Bullish/Low-Vol to Bearish/High-Vol Regime: PMs will express their bearish outlook by reducing their net exposure, and in doing so, they will sell their most aggressive longs (cyclical sectors, momentum names and/or low-conviction names). Gross leverage is a double-edged sword: it can help boost the portfolio returns by capturing more factor or alpha while keeping the portfolio somewhat neutral to market gyrations (beta neutral), but it also exposes the portfolio to factor unwind risk, covariance spikes, and other hidden risks. Depending on the amount of alpha perceived to be out there—best measured by the DSPX index—PMs can decide to be aggressive and increase the gross exposure or be more conservative and lower it. As I am writing this post, in October 2025, the dispersion trade is running at full steam and PMs are running on average 220% gross leverage with a conservative 50% net exposure. This is a result of Trump’s market: scary macroeconomics keeps PMs conservative on the net exposure but extreme sector rotation from Trump’s agenda is creating tremendous alpha opportunities, inciting PMs to play the alpha hunt with a high gross exposure. This is the telltale sign of a bull market long in the tooth: correlation—both implied and realized—has been pushed to extremely low values, and price action is dictated by factor rotations, which can create large intraday volatility in single names while keeping the index reaction muted.
Sudden Volatility Spikes: With an increase in volatility always comes an increase in correlation. The portfolio manager (PM) is constrained by his risk management, he will de-risk immediately: the goal is to lower both the gross and net exposure. Shoot first, ask questions later. This kind of reaction can lead to tremendous intraday volatility while crowded names are being sold and bought. Indiscriminate selling often means great buying opportunities for other traders with available capital to invest. These adjustments are tactical (1-4 weeks) until vol normalizes.
From Bearish/High-Vol to Bullish/Low-Vol Regime: PMs will start to increase their net exposure and unwind their expensive hedges. As the bull market evolves and borrowing costs are going down, they can start to add some additional leverage to their high-conviction longs. A bull market often starts with a “breadth thrust,” a fancy technical name to say that a rising wave lifts all boats. Breadth is measured by the percentage of stocks above a given moving average, let’s say the 50-day moving average. In statistical terms, it means the correlation is close to 1: most stocks are going up, which means there is a big beautiful beta to chase here, while the amount of alpha is very small. This is a low-dispersion environment which motivates the PMs to run a higher net exposure while keeping gross exposure rather low. As the bull market evolves, and the correlation (or breadth) starts to decline, the dispersion will rise at the same time, giving an incentive for the PMs to increase their gross leverage: this is the beginning of the alpha hunt. In general, they will pile into long names exposed to the momentum factor and short names exposed to the value or low volatility factor.
A big caveat to all these dynamics: I am looking at the equity L/S hedge fund industry on aggregate. Some funds are beta neutral all the time, focusing only on factor harvesting. They can also be beta and factor neutral, focusing only on capturing alpha. Finally, some funds are a mix of everything; they can be beta and/or factor timers.
Below is an excerpt from the GS research. I have overlaid the S&P 500 index in red so you can get a sense of the dynamics between leverage and market regimes.
Beta Compounders: Family Offices, Pensions, Endowments, SWFs.
Beta compounders, encompassing pensions, endowments, family offices, and sovereign wealth funds (SWFs), stand in stark contrast to hedge funds. While hedge funds chase absolute returns uncorrelated to markets through aggressive long/short bets and high leverage, beta compounders focus on long-term preservation and steady growth that often tracks broader markets. They diversify across asset classes like equities, private equity, real estate, and infrastructure, avoiding shorts and keeping leverage minimal to harvest illiquidity premiums.
Unlike hedge funds’ alpha-hunting, performance-fee-driven frenzy where brilliant but greedy PMs crank up leverage after hot streaks, beta compounder managers are beta stewards, rewarded for patient diversification and compounding. They’re strategic navigators, not traders, but this means they’re slower to pivot, potentially missing tactical edges or clinging to laggards. These investors can employ a mix of passive and active investing strategies.
Beta compounders command 40-50% of global institutional assets, dwarfing hedge funds’ 25-30% slice of U.S. equity volume. Their reallocations are less frequent but powerful. For instance, an SWF might shift billions from bonds to gold, or ditch cyclical stocks for defensives, rippling through markets for months. While they can change the long-term trend of positioning data, they have minimal impact on day-to-day changes. They are less active than hedge funds.
Their factor exposures emphasize enduring themes like growth, income, inflation hedges, and screened for multi-year commitments versus hedge funds’ quantitative factor plays vulnerable to crowding and rotation.
Reaction-wise, they’re endurance athletes to hedge funds’ sprinters: deliberate, board-guided reallocations with liquidity buffers, not tight stop-losses or overnight liquidations.
Their reaction function is much more muted:
From Bullish/Low-Vol to Bearish/High-Vol: No panic de-risking like with hedge funds. Instead, hold steady, tap reserves, and scoop undervalued assets, turning drawdowns into opportunities over quarters.
Sudden Volatility Spikes: Methodical trimming of publicly traded stocks, holding illiquids, providing market ballast as hedge funds dump in haste, with adjustments unfolding strategically over months.
From Bearish/High-Vol to Bullish/Low-Vol: Gradual ramp-up in growth bets through public equities and deploying cash into fresh privates, pushing illiquidity to 60%+ as stability reigns, compounding gains where hedge funds might over-lever and flame out.
The Wild Card: Retail Investors
If you’ve ever wondered how big the retail investor flow is, look at the chart below:
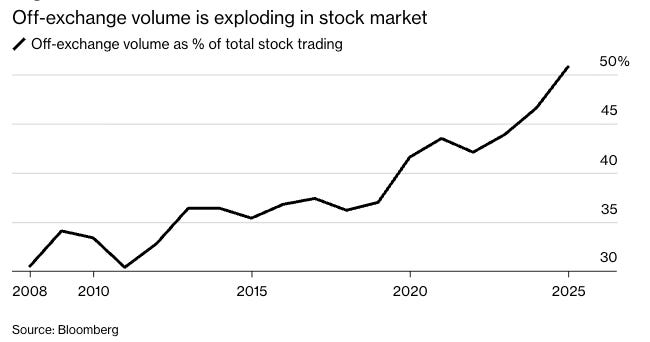
Off-exchange volume refers to stock trades executed away from public exchanges like the NYSE or NASDAQ, often through alternative trading systems (ATS), dark pools, or internalized by market makers. It is a very good proxy for retail investor activity because most of this flow is tied to Payment for Order Flow (PFOF).
Fun fact: Did you know that PFOF was pioneered by Bernard Madoff in the 1990s? It allows brokers to earn compensation from market makers for routing client trades—a practice that became widespread but controversial due to potential conflicts of interest. Robinhood, founded in 2013, popularized a new business model by relying heavily on PFOF to fund zero-commission trading, eliminating traditional fees and democratizing access to markets.
The rise of the retail investor is a new generational secular force. It got a boost with the COVID lockdown and zero-commission trading, when everyone stuck at home began trading from their mobile phones. The participation rate for the 25-year-old cohort is extremely high; the retail crowd is not only larger than ever, but also younger and bolder.
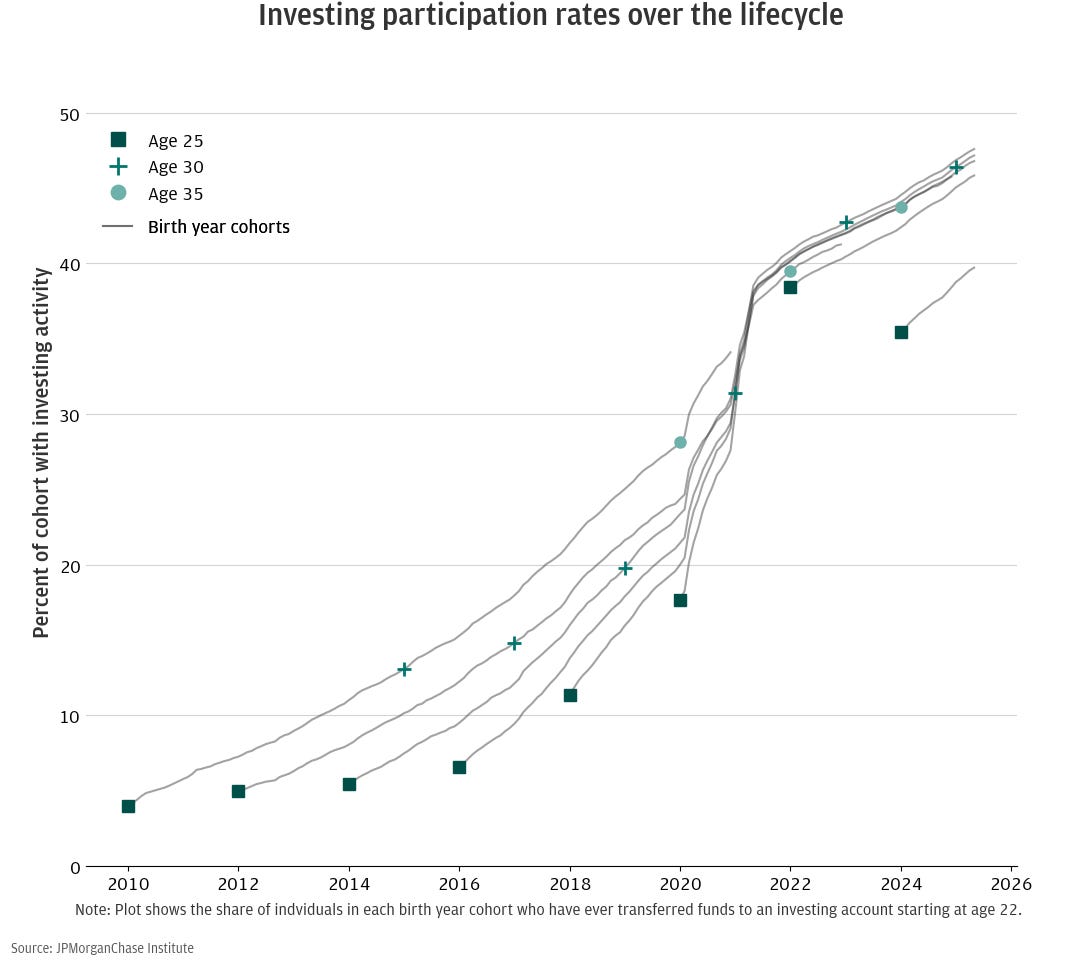
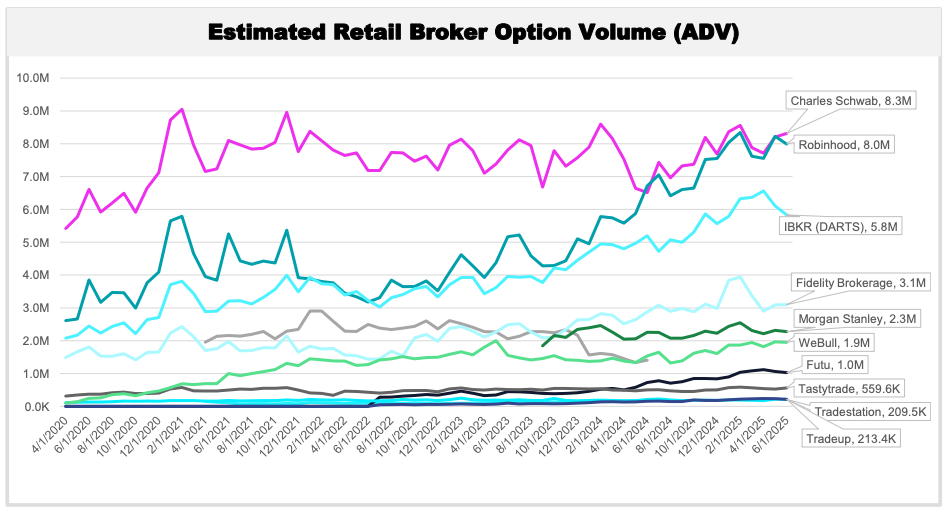
The housing market is probably another reason for this new trend: young people cannot afford a mortgage, so their only path to riches is the stock market. They have become extremely aware of their loss of purchasing power compared to their elders. The only way to get out of this debasement spiral is to invest in the market—heavily, with leverage through options. The chart below is a testament to this mindset shift, showing the rise of Robinhood option volume, now matching Schwab’s ADV.
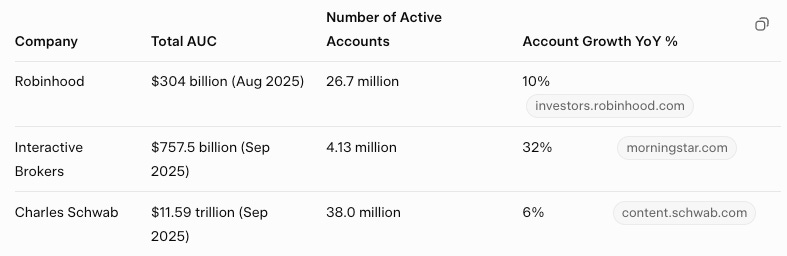
This is an extremely important data point. Charles Schwab is many times bigger and older than Robinhood:
So, what are the implications for the stock market, and what is their reaction function?
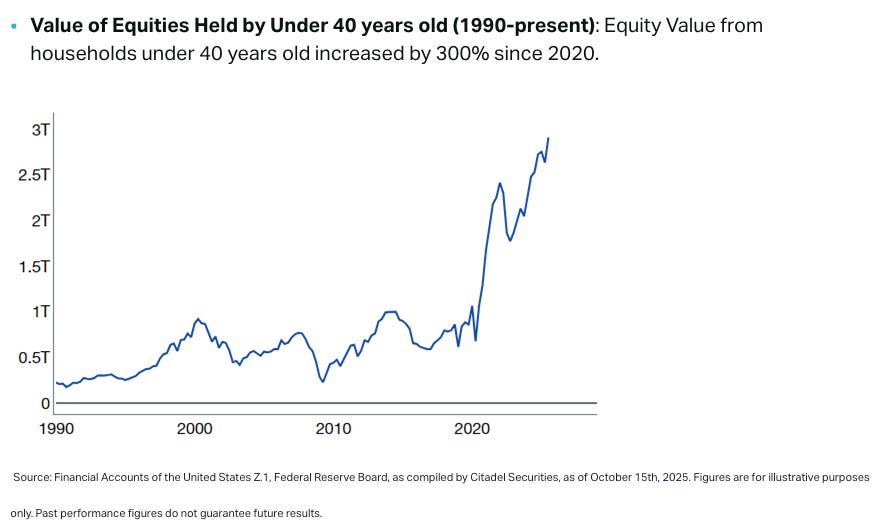
Retail investors are flushed with money, and the most risk-seeking crowd (those below 40 years old) has close to $3T in equities. While this equity value will decline with a market downturn, they will use leverage and options to buy the dip. Do not underestimate their dip-buying resilience. The tragedy of this system is that eventually, a dip will keep dipping, and a wave of margin calls will wipe out trillions from the market. This is an Armageddon scenario for the market—the kind that happens every 30 years and creates fertile ground for a prolonged bear market. This is not our base-case scenario, but we need to consider it.
The chart below from Citadel illustrates my point about leverage and options. The last spike happened during a mere 3% dip in October.
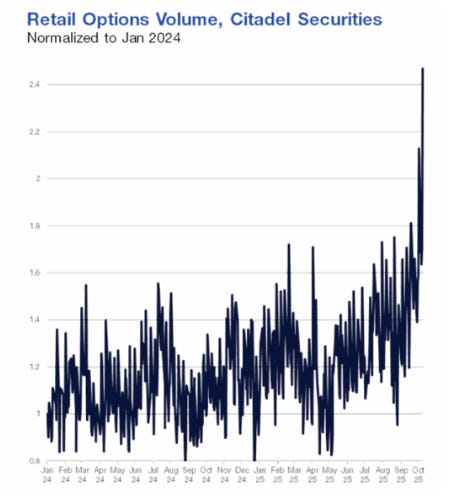
Friday’s surge epitomized the “buy-the-dip” mentality. Retail flow skewed 11% better to buy via our Call/Put Direction ratio (vs. a 4% average over the past 3 months), marking the largest single-day call buying ever on our platform.
This is historic. Retail investors are supporting the market and, ironically, by chasing volatility, they are also suppressing it. The chart below from Vanda gives us an insight into their behavior over the past year:

Retail investors have been chasing volatility both on the downside (during the Trump Tariff Turmoil) and now on the upside. Retail investors are the wild card: they chase volatility and have a unique reaction function. This is the result of the widespread belief that “stocks only go up” while the currency loses its purchasing power day after day. Chasing volatility also means you do not care about taking drawdowns—there is even a sense of pride in surviving a 30% drawdown, like during Liberation Day, and then exiting the year with large gains. The mood has shifted from capital preservation to upside maximization. In my opinion, this is a direct consequence of the COVID boom and the new cohort of investors in the market: too young to remember the Lehman Brothers bankruptcy in 2008 but old enough to remember the GameStop short squeeze in 2021. Retail investors are not playing the same game as other discretionary traders. They don’t have a risk manager tapping on their shoulders when they are over their skis, nor do they have clients to answer to after a 30% drawdown. For them, this is all a game, and in the casino, there is no crying. Trade accordingly.

Conclusion
In essence, beta compounders form the sturdy spine of market positioning—the slow, inexorable trend that shapes long-term flows—while hedge funds add the jittery noise, dancing to the whims of hot narratives, factor rotations, and regime flips. Picture it mathematically: overall positioning resembles a random walk, where beta compounders supply the steady drift (that persistent upward bias from patient allocations compounding over cycles), and hedge funds inject the volatility. Retail investors are the wild card: They seek volatility both on the downside and the upside, walking off as either heroes or zeros. YOLO!
If you’ve enjoyed this post, stay tuned for Part II: Systematic Investors, the Cold-Hearted Algorithms. We’ll unpack the mechanical minds driving the action, from CTAs to Vol Control Funds and other market actors.
Great article. How do you think the QIS (short vol with (tail) hedgers, QIS supplying vega into the market, compressing implieds, until stress hits — when they rebalance or pull risk down, contributing to vol spikes.) and retail VIX space (VXX, SVIX, UVXY,VVIX) factor into the mix? Investment banks are very active in the former (as market markers) and CBOE in the latter and both increased a lot in size.
P.S. The ChatGPT answer is:
VIX space acts as a transfer market between:
Institutional hedgers seeking convexity,
Retail and ETF investors trading volatility tactically,
Systematic strategies harvesting the vol risk premium.
In 2025, the picture looks roughly like this:
QIS platforms dominate the systematic risk premia space (hundreds of billions notional).
The VIX ecosystem is deep and liquid, but also crowded in short-vol exposures.
New products (like 1-day VIX, or dispersion indices) further tighten the link between QIS flow, index option liquidity, and VIX curve dynamics.
Investment banks’ QIS desks therefore function as market makers of volatility exposure, while the VIX complex is the marketplace through which those exposures are priced and transferred.
I have to say this post is in my Top 5 blog posts for the year - closed quite a few holes in my understanding of market structure. For example i think i underestimated the impact of retail relative to the other market actors and how relentless the dip buying actually is. Your post also raised some new questions though that i hope you can help me with:
(1) Is there an overlap between the 53% of US AUM share of passive and the retail trading proxied by 50% off-exchange volume? I'm guessing yes because retail also buys index funds via robinhood etc. Or to ask that differently: What is your rough estimate of how much of the 50% off exchange volume is just buying index funds and how much is stock picking?
(2) From your post i gathered ~50% retail trading (off-exchange) and ~25-30% Hedge Fund Trading relative to traded stock volume. Also you mentioned beta compounders commanding ~40-50% of global insti AUM (but that includes more than just us equities). So would it be a fair assumption to say that retail accounts for ~ 1/2 of us equity volume and HFs and beta compounders each about ~1/4 ? Or is this misleading because HFs can increase/decrease net exposure in hours. I am just trying to guesstimate each groups relative impact on markets and i know that probably nobody has exact data on this.
(3) Regarding beta compounders - are they mostly bound by a benchmark like a global 60/40 and judged on their tracking error? Or could they theoretically do something wild like going to 70% cash / excluding US equities / switching bonds for gold?
Thanks!