
Positioning Update - CoT (1/2)
3 metals, 3 different stories

One of the unexpected side effects of the last US government shutdown was the lack of new positioning data from the Commitment of Traders (CoT) reports. It was a very annoying inconvenience, as my trading process relies heavily on them. Now we have a lot to catch up on; this will be split into two posts.
Since there are quite a few new subscribers here, and because I have procrastinated on part II of the Hitchhiker’s Guide to Positioning, I will start with a reminder of how the CoT works.
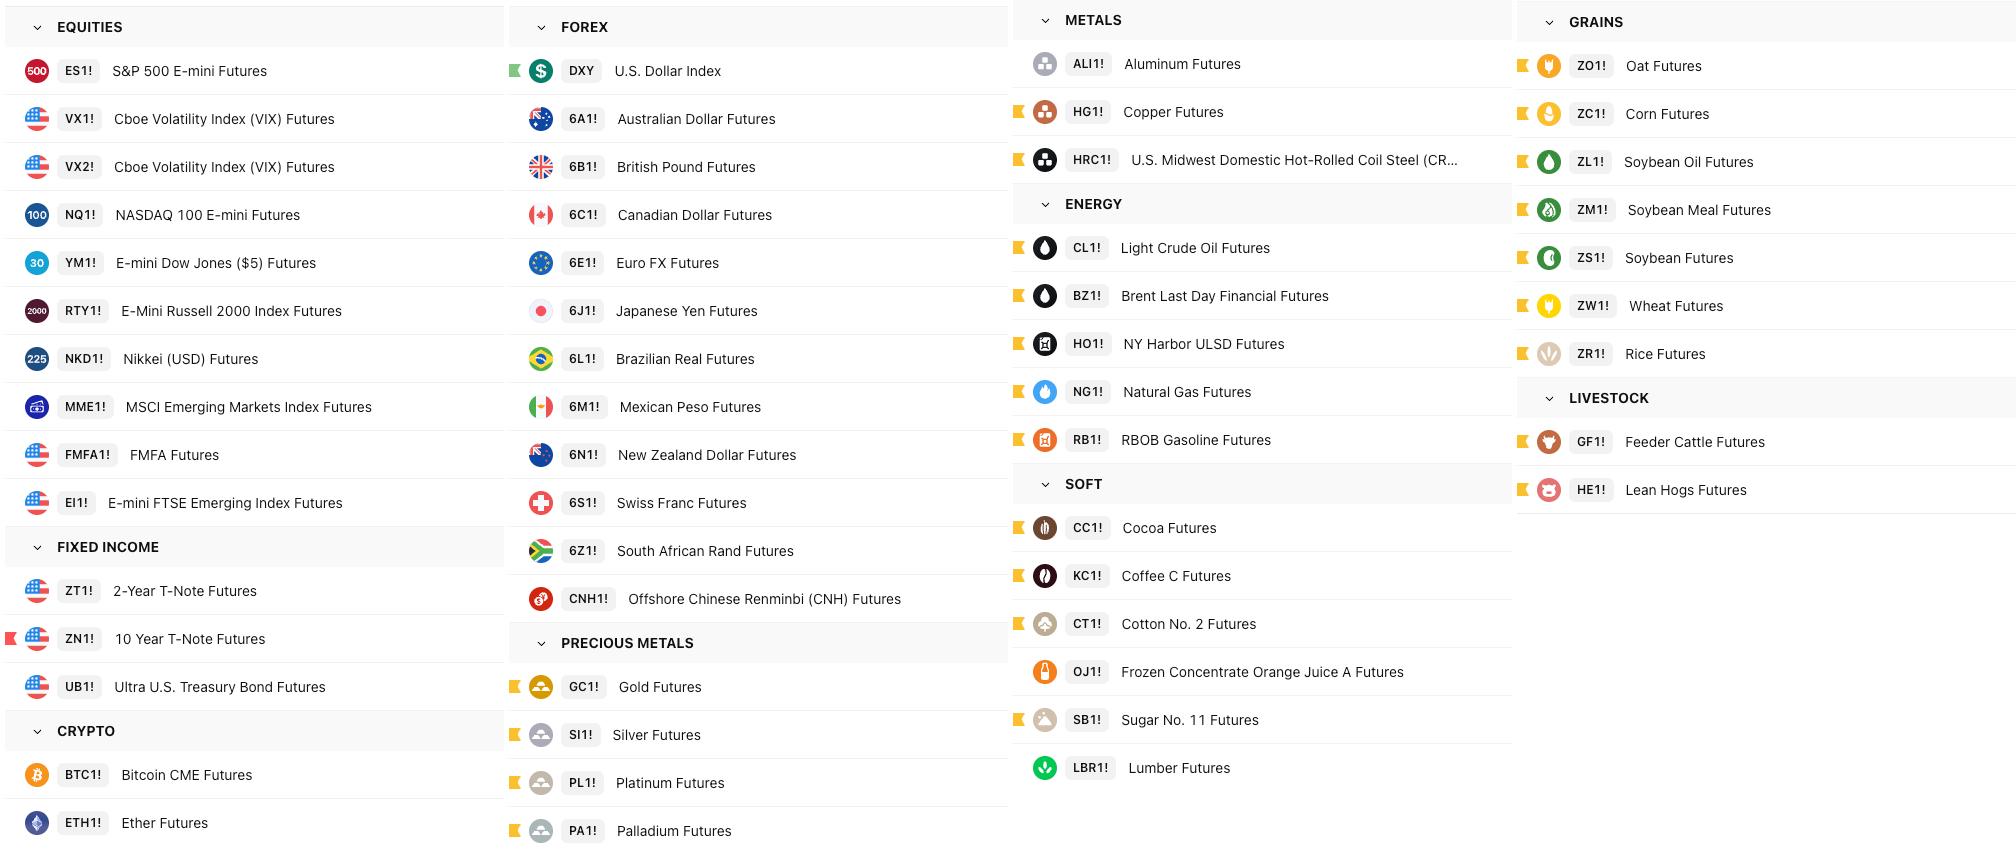
The CoT covers all futures traded on the COMEX. My TradingView watchlist is based on the universe of futures below:
Luckily, TradingView has a built-in library for accessing CoT data (and it’s free!). I modified their script to make it my own, reusing Jason Shapiro’s color coding (the contrarian OG, check him out at crowdedmarketreport.com). My default template looks like this:
The data in CoT reports is collected as of Tuesday and released on Friday. It provides a weekly data point expressed in number of contracts. TradingView simply holds the same value from Tuesday until the following Monday.
The CoT report categorizes participants into three main groups:
Commercials (or Hedgers): These are businesses that use futures markets primarily to hedge price risks associated with their underlying commodities or financial instruments. They are often producers or processors of the commodity and are considered to have an informational advantage due to their closeness to market fundamentals.
Large Speculators (or Non-Commercials): This group includes professional traders such as hedge funds, commodity pool operators or family offices. Their main objective is to profit from price movements, and they typically focus on longer-term trends.
Small Speculators (or Non-Reportables): These are smaller retail traders whose positions do not meet the reporting thresholds set by the Commodity Futures Trading Commission (CFTC). They also speculate on price movements.
In equity markets, such as E-mini S&P 500 (ES) futures, the “Commercials” category consists of institutions that use futures contracts for hedging rather than speculation. Unlike in commodity markets, where commercials are producers or processors, participants in equity futures are financial firms hedging risks in their stock portfolios.
For equity futures, the Commercials category includes:
Banks and large financial institutions: Proprietary trading desks at investment banks may use ES futures to hedge exposure to the broader equity market or to offset over-the-counter (OTC) derivative products like swaps.
Pension funds and mutual funds: These institutional investors hold very large stock portfolios and use ES futures to hedge against potential declines in the overall market, protecting the value of their holdings.
Insurance companies: As large institutional investors, insurance companies hold extensive equity portfolios and use futures to manage market risk.
Index arbitrage desks: These desks exploit the difference between the price of index futures and the value of the underlying stocks. They are classified as commercial hedgers because their futures trading is directly tied to cash-market activities.
Although hedge funds are major players in the futures market, they are typically classified as Large Speculators (Non-Commercials) in the CoT report because their primary objective is to profit from market movements rather than to hedge a core business activity. This can be an issue for the data quality as they hedge other positions using futures.
Open Interest (OI) refers to the total number of outstanding futures contracts that have not yet been settled or closed out, across all expiration months. OI increases when new buyers and new sellers enter the market and create new positions. It decreases when existing positions are closed out (e.g., through offsetting trades). Flat OI indicates that the number of new positions opened roughly equals the number of positions closed.
The table below summarizes these mechanics:
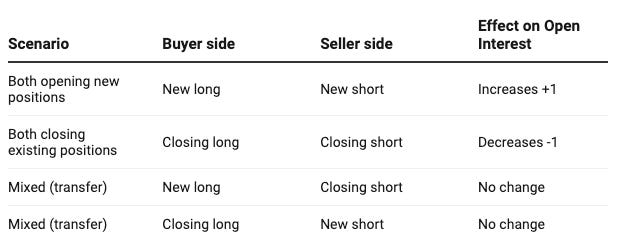
Keep in mind that Open Interest does not measure the balance between buyers and sellers. Instead, it reflects whether trades are creating new contracts (attracting fresh capital/participants) or closing existing ones (participants exiting). Flat OI typically suggests a roughly balanced flow—new entrants replacing those who are leaving—rather than net expansion or contraction of positions.
Once we understand how net open interest (OI) changes, we can interpret it in the context of price action and volume.
Some trading books provide blueprints for how markets should behave based on trends and OI changes. In practice, however, each market has its own dynamics and must be studied in light of its specific microstructure. You cannot interpret open interest and positioning the same way across Bitcoin futures and S&P 500 E-mini futures. They feature very different players and futures curve dynamics.
For example, Bitcoin is still a relatively new asset, so its forward curve can swing wildly, attracting both directional speculators and basis carry traders. One group takes liquidity to establish directional bets, while the other provides liquidity to collect funding rates. Both affect open interest identically, as they are two sides of the same coin. This dynamic does not apply to S&P 500 futures, an extremely mature market with far more participants pursuing widely varied objectives. Commodity markets represent yet another distinct world where physical delivery add another layer of complexity.
This is a long way of saying that you should be cautious about generalizing positioning across markets. Nevertheless, a few key insights hold true regardless of the underlying asset:
Large Speculators, as defined by the CoT, are the primary drivers of OI changes because they act as liquidity takers. They enter when speculating on a new trend, while their counterparts—commercial traders—are liquidity providers who are content to lock in favorable prices for hedging future cash flows. By definition, Large Specs are trend followers, while commercials are mean reverters.
Rising OI during an uptrend is bullish; rising OI during a downtrend is bearish. New speculators are entering aggressively, buying (or selling) into the bull (or bear) move and sustaining momentum.
Rising OI also signals that “paper hands” or fast money is piling in. These momentum players typically use stop losses, so as OI grows, the cluster of potential stop orders below current price increases. The distribution of future outcomes gradually shifts to negative skew: the most likely path is trend continuation, but any setback risks triggering forced selling that exacerbates downside moves.
Trees don’t grow to the sky, and neither does open interest. At extreme highs, OI tends to correct, either through gentle price consolidation or sharp resets. COMEX copper futures offer many examples of nasty resets; the August flash crash is a recent one. Such events clear out weak hands and pave the way for the next leg.
Spikes in OI near contract expirations often reflect rollovers rather than new trends. In contango or backwardated markets, hedgers and speculators roll positions to the next contract, temporarily inflating OI without directional intent. Ignoring this can produce false signals.
Extreme OI relative to historical norms signals vulnerability. When OI reaches multi-year highs, it frequently precedes volatility spikes or trend reversals as crowded trades unwind.
Combining OI with volatility metrics strengthens trend confirmation. Rising OI in low-volatility environments suggests building tension and a potential breakout, whereas in high-volatility regimes it can amplify moves but also indicate froth.
Now that we’re all clear on the CoT data, let’s look at the actual positioning data and what caught my eye. Starting with everyone’s favorite...
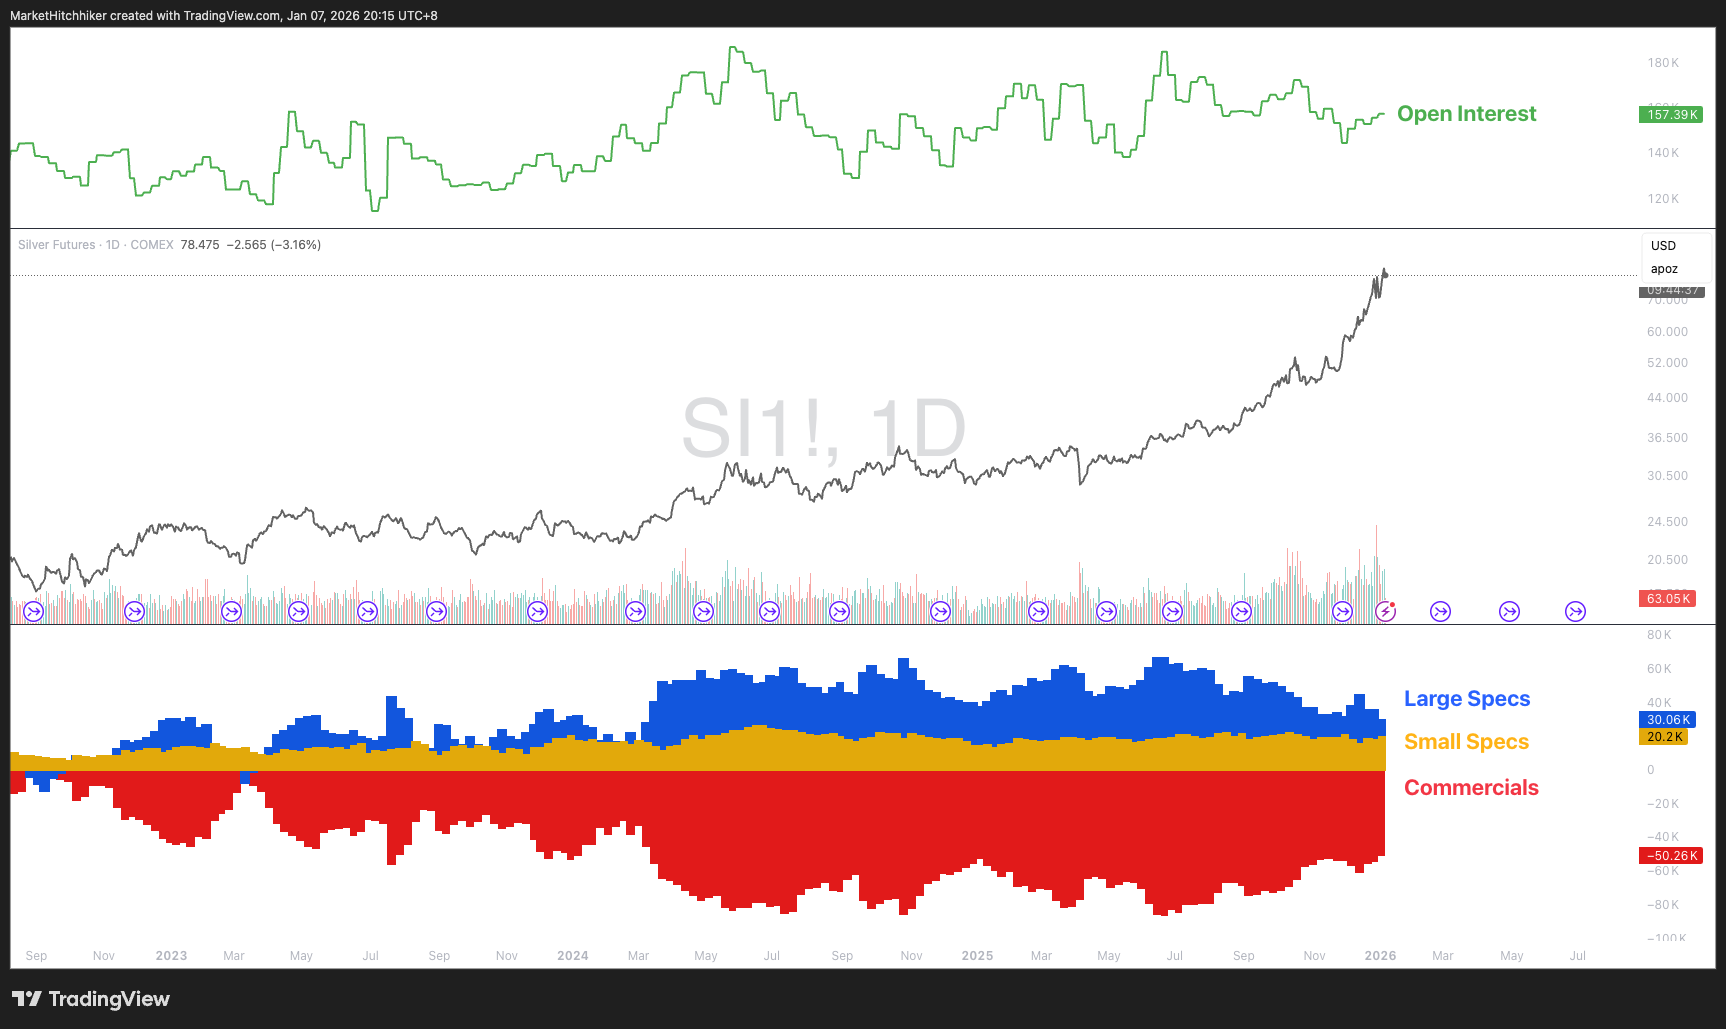
Silver: Not a single day passes in the financial media without a mention of silver. The bull case is common knowledge and goes as follows (thank you, Grok):
Silver’s bull case in early 2026 is driven by its dual role as a precious and industrial metal, with surging demand from green energy (solar panels, EVs) and tech (AI, data centers) amid structural supply deficits. Institutional buying, including central banks, has fueled a multi-year rally, with 2025 gains exceeding 140% and potential for triple-digit prices if monetary risks persist. Its addition to the US critical minerals list underscores strategic importance, while cheaper valuation versus gold offers asymmetric upside as an inflation hedge. Analysts see further momentum from energy transitions and tech adoption, with targets up to $150/oz possible in bullish scenarios.
With all the cheerleading around silver, you’d assume everyone is uber-long. According to the CoT data, large speculators are actually selling into this parabolic rise! Small speculators are maintaining roughly the same exposure as always. This leaves commercial positioning rather long (relative to the past).
In addition, open interest net change remains quite flat. While the price action resembles a blow-off top, the positioning is actually very conservative. People are selling and taking profits into this move. Trying to pick a top here seems to offer very poor risk/reward. Fading the price will get you nowhere if market participants have already sold. I absolutely hate to say this after such a dramatic rise, but the risk/reward favors the bulls. However, I am not chasing silver here because I cannot bring myself to buy this “high,” and I am not shorting it either. Sometimes you just want to stay out of trouble.
Palladium: Contrary to silver, palladium is exhibiting what looks like crowded positioning. Large speculators have fully bought back their short positions, while small speculators have never been this long. Commercials are now net sellers.
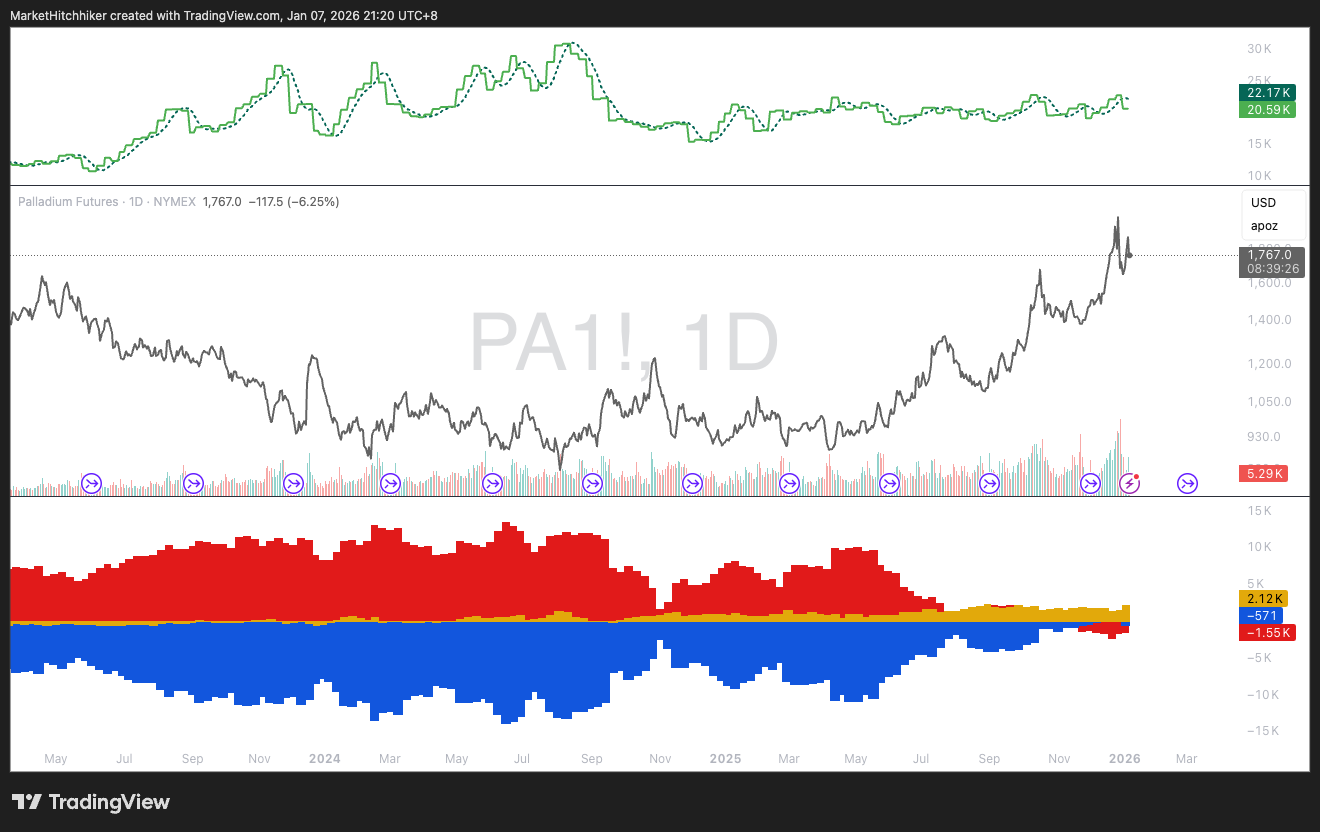
One’s first reaction might be to think that palladium is a much better short than silver, based purely on positioning analysis. While this could make sense for a short-term trade, the long-term picture is more nuanced. Palladium is emerging from a nasty bear market; zooming out over the last 10 years, large speculators’ positioning is actually very light.
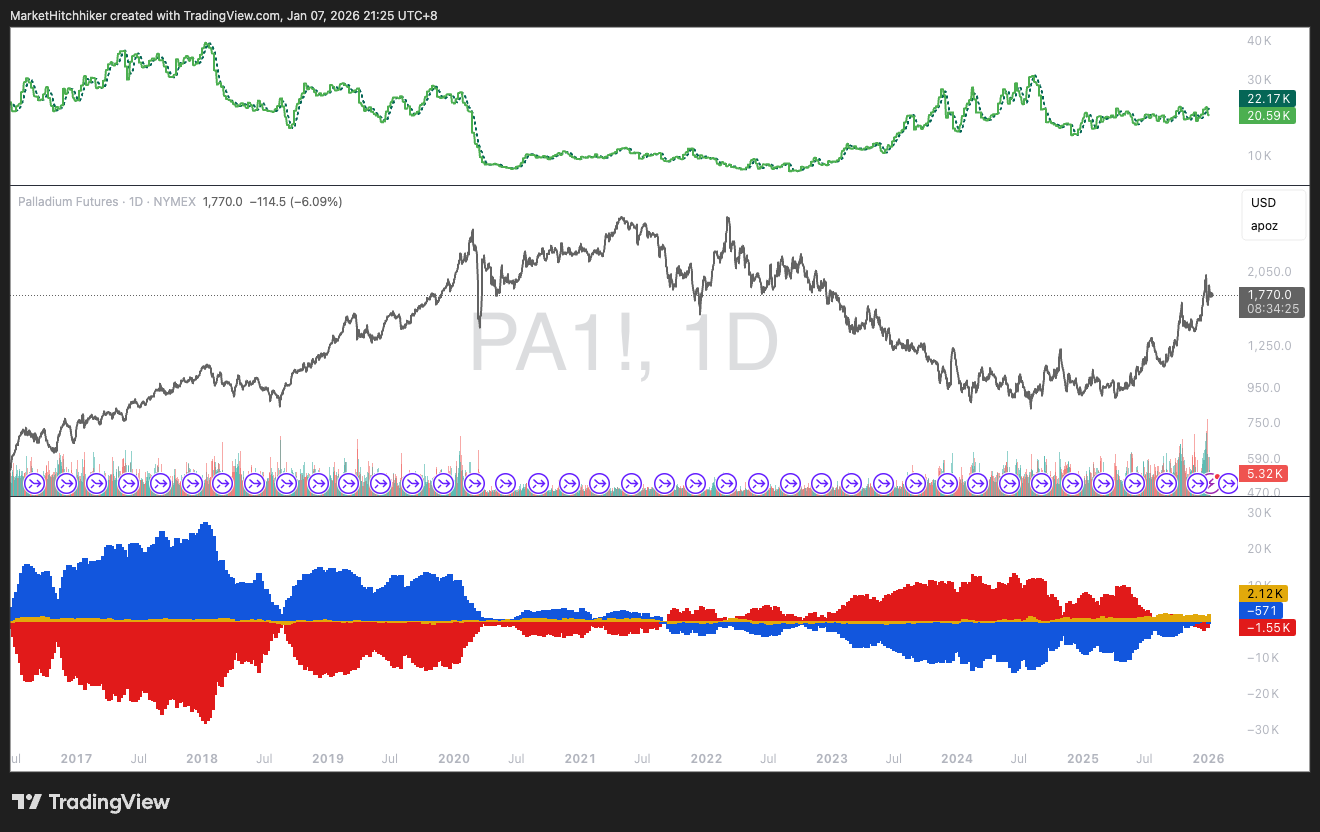
What seems to be happening right now is simply a repricing of palladium. On the back of the decline of ICE vehicles, palladium was left for dead in 2024, only to come back as part of the debasement trade.
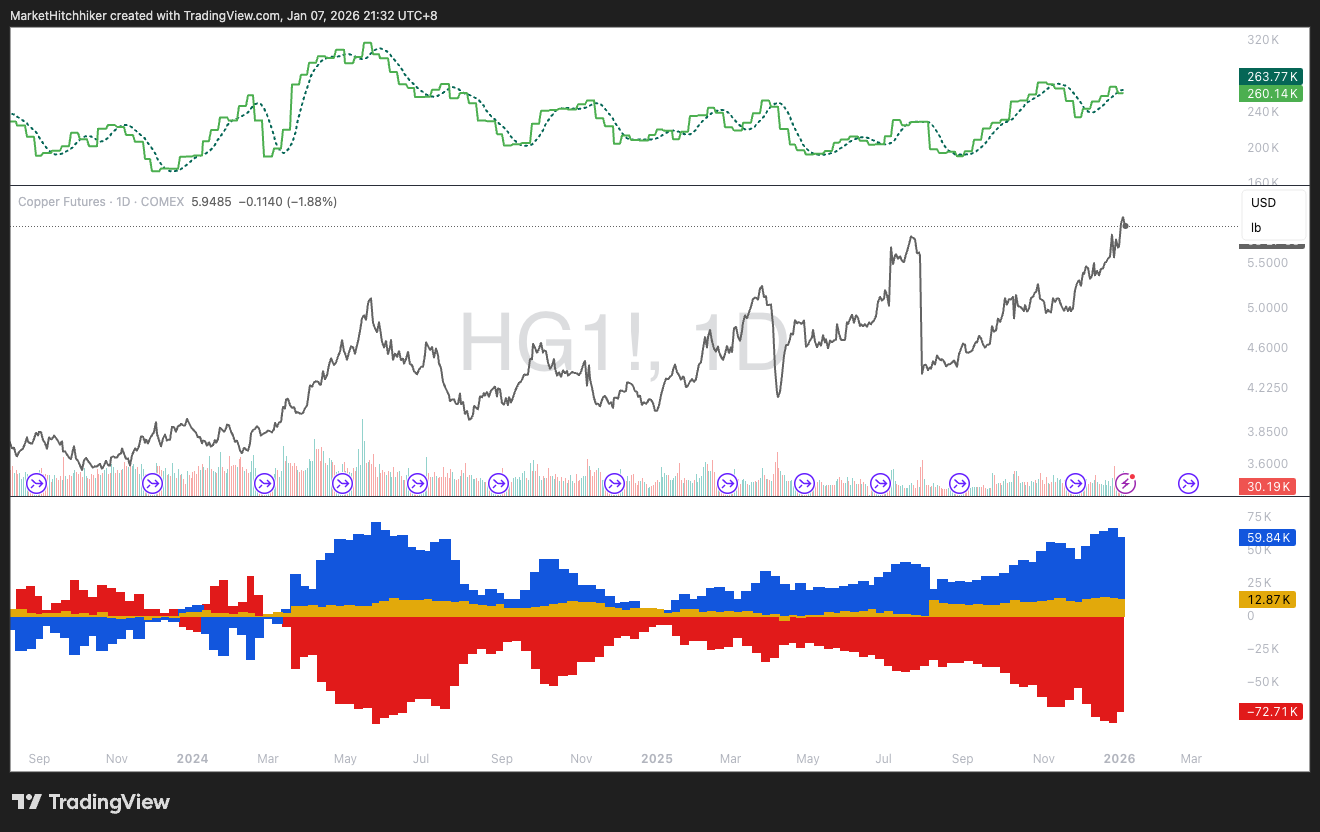
Copper: Now that’s what a crowded long looks like! Large speculators are getting very long; last week saw a small downtick, but with copper above $6.0, I expect the next reading to be higher. Small speculators are rather long too. Open interest has been rising gradually after a brief reset around November. I am not shorting this market now, as I still expect one last parabolic move. But it could offer a very nice risk/reward on the short side very soon.
Grok’s bull thesis, or, what everyone knows:
The bull thesis for copper in 2026 hinges on surging demand from the global energy transition, electric vehicles, and AI data centers, outpacing constrained supply. Mining disruptions, declining ore grades, and potential U.S. tariffs exacerbate shortages, projecting a global deficit of ~330kmt. Economic recovery in China and lower interest rates further bolster prices. Analysts forecast averages of $12,000-$12,500/mt, with peaks up to $15,000/mt amid structural imbalances.
To be continued tomorrow. I will look at forex, crypto, and equity indices.
Great piece as always! Answered a few questions for me but one thing i still don’t understand: i get that the commercials category in commodity futures is closer to fundamentals and therefore has informational advantage. But why would the commercials in equity futures be better informed than large specs? Thanks 🙏