
S&P 500 Tactical update before Nvidia's earnings and job report
Do I remain Risk-off?

Yesterday, the S&P 500 finally closed below its 50-day moving average after a record 137 consecutive days above it. This is highly unusual. Subu Trades ran the numbers:

At first glance, this looks quite bullish. But on closer inspection, most of the bullishness comes from data before the 1990s—a time when computers were far less common and a simple moving average already provided a meaningful edge.
The Times They Are A-Changin’
As far as I’m concerned, what happens next is a coin toss based on that table. But there are still other signals worth watching.
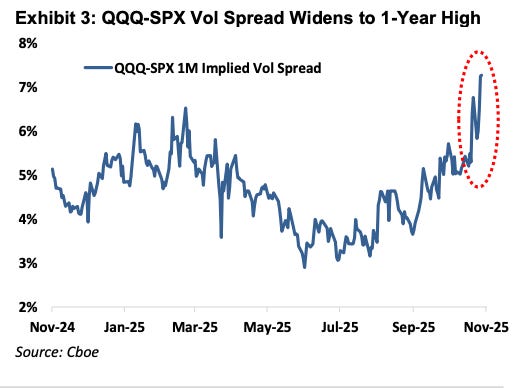
The spread between Nasdaq and S&P 500 implied volatility has been soaring. The current market jitters are 100% an AI malaise, and it all started with Meta’s earnings miss on higher capex. As I already mentioned, that was exactly the scenario in my pinned post on X from September 23.

And here we are:
The coming two days are crucial, and the term structure reflects it:
SPX Nov 18 IV: 21.1%
SPX Nov 19 IV: 20.9%
SPX Nov 20 IV: 24.2%
SPX Nov 21 IV: 23.5%
A quick forward vol computation gives us the daily expected move:
SPX Nov 18 IV: 21.1% / √250 = 1.33%
SPX Nov 19 IV: √(2 × 20.9%^2 − 21.1%^2) / √250 = 1.31% (NVDA earnings)
SPX Nov 20 IV: √(3 × 24.2%^2 − 2 × 20.9%^2) / √250 = 1.95% (jobs report)
SPX Nov 21 IV: √(4 × 23.5%^2 − 3 × 24.2%^2) / √250 = 1.34%
Yes, there’s a kink in the vol surface. Thursday is crucial because we’ll finally get new hard data on the job market.
Let’s review the VIX and SPX trades shared on the Substack.
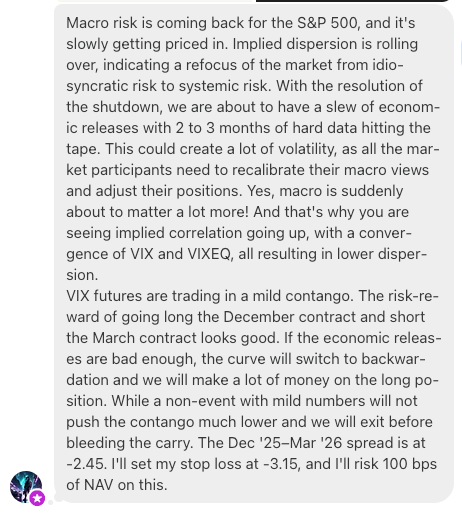
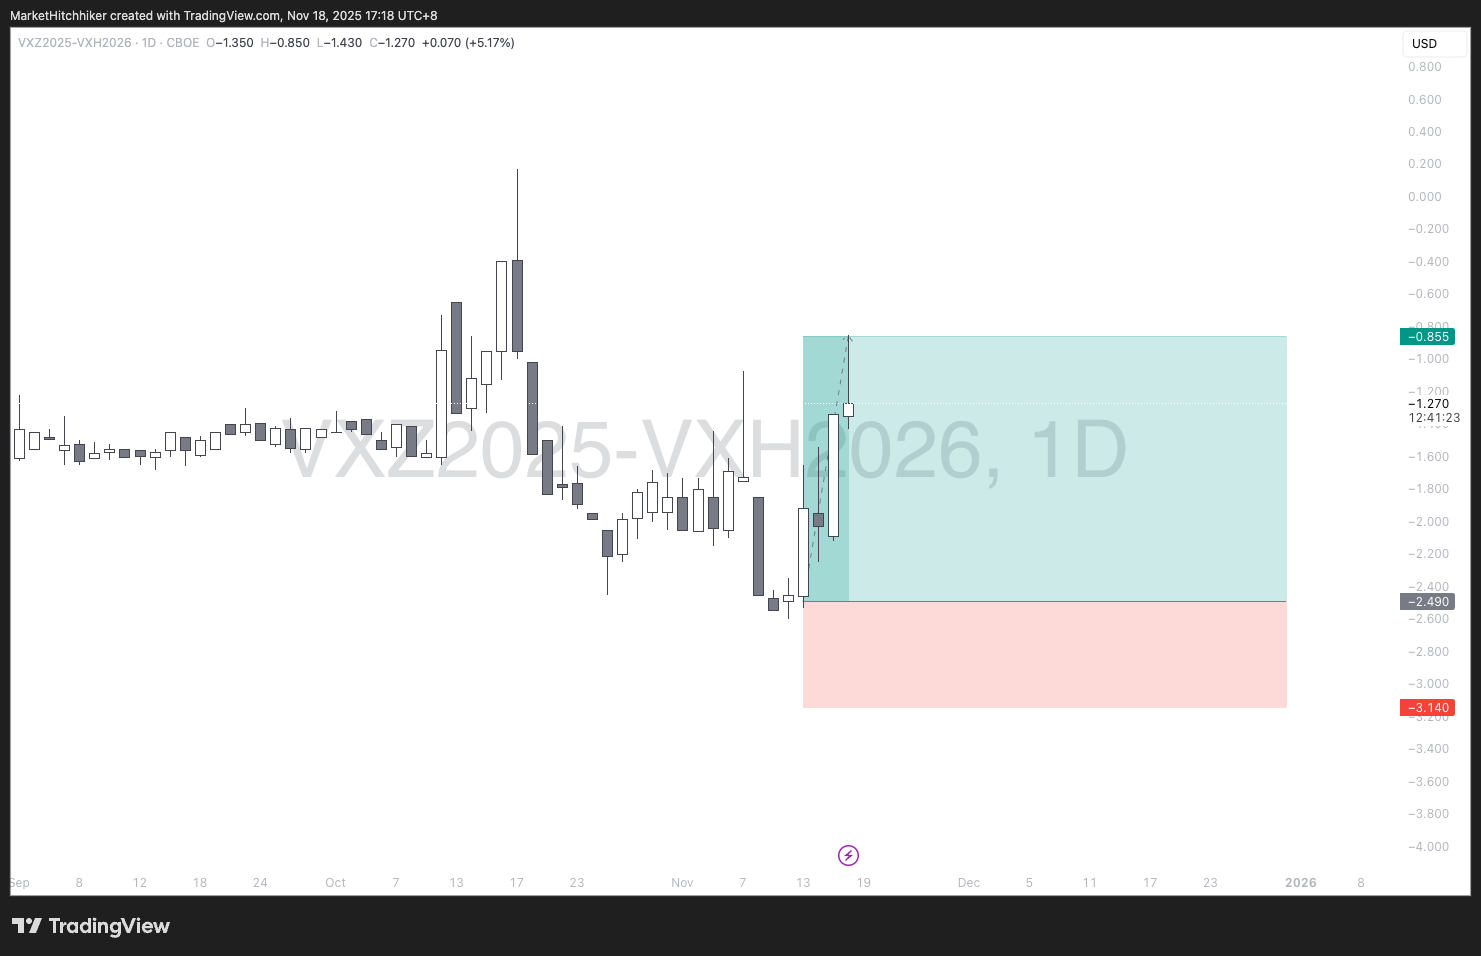
The VIX calendar initiated on November 13 is now sitting on a nice profit. I will close it before Thursday’s jobs data. The risk of a vol crush is too high.
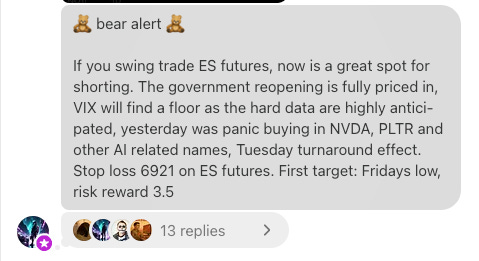
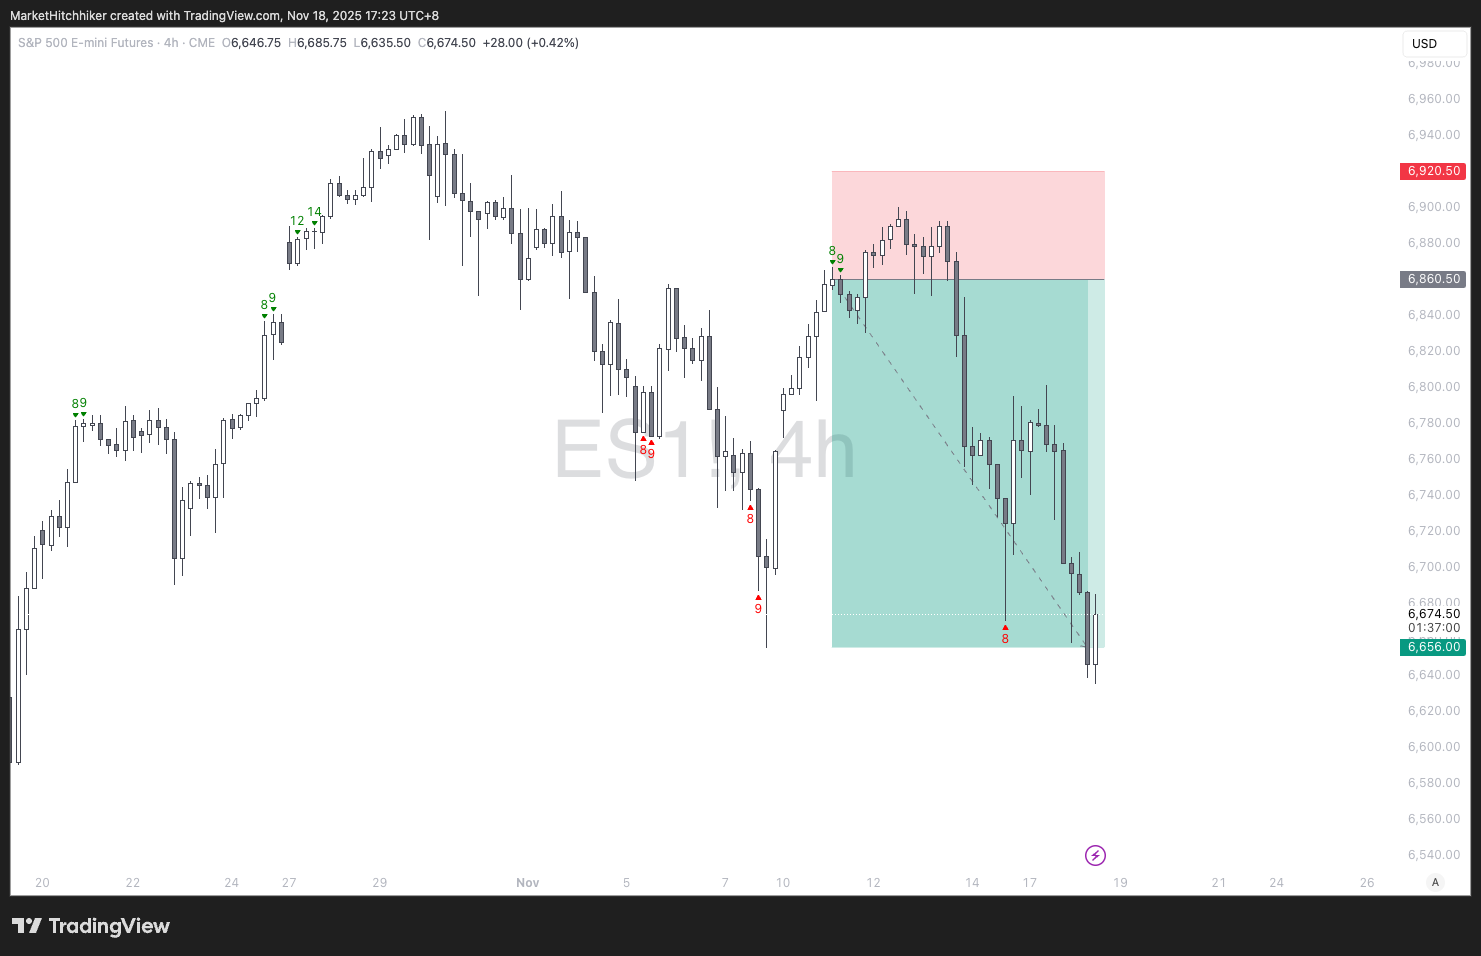
The bear alert from the 12th is also working well:
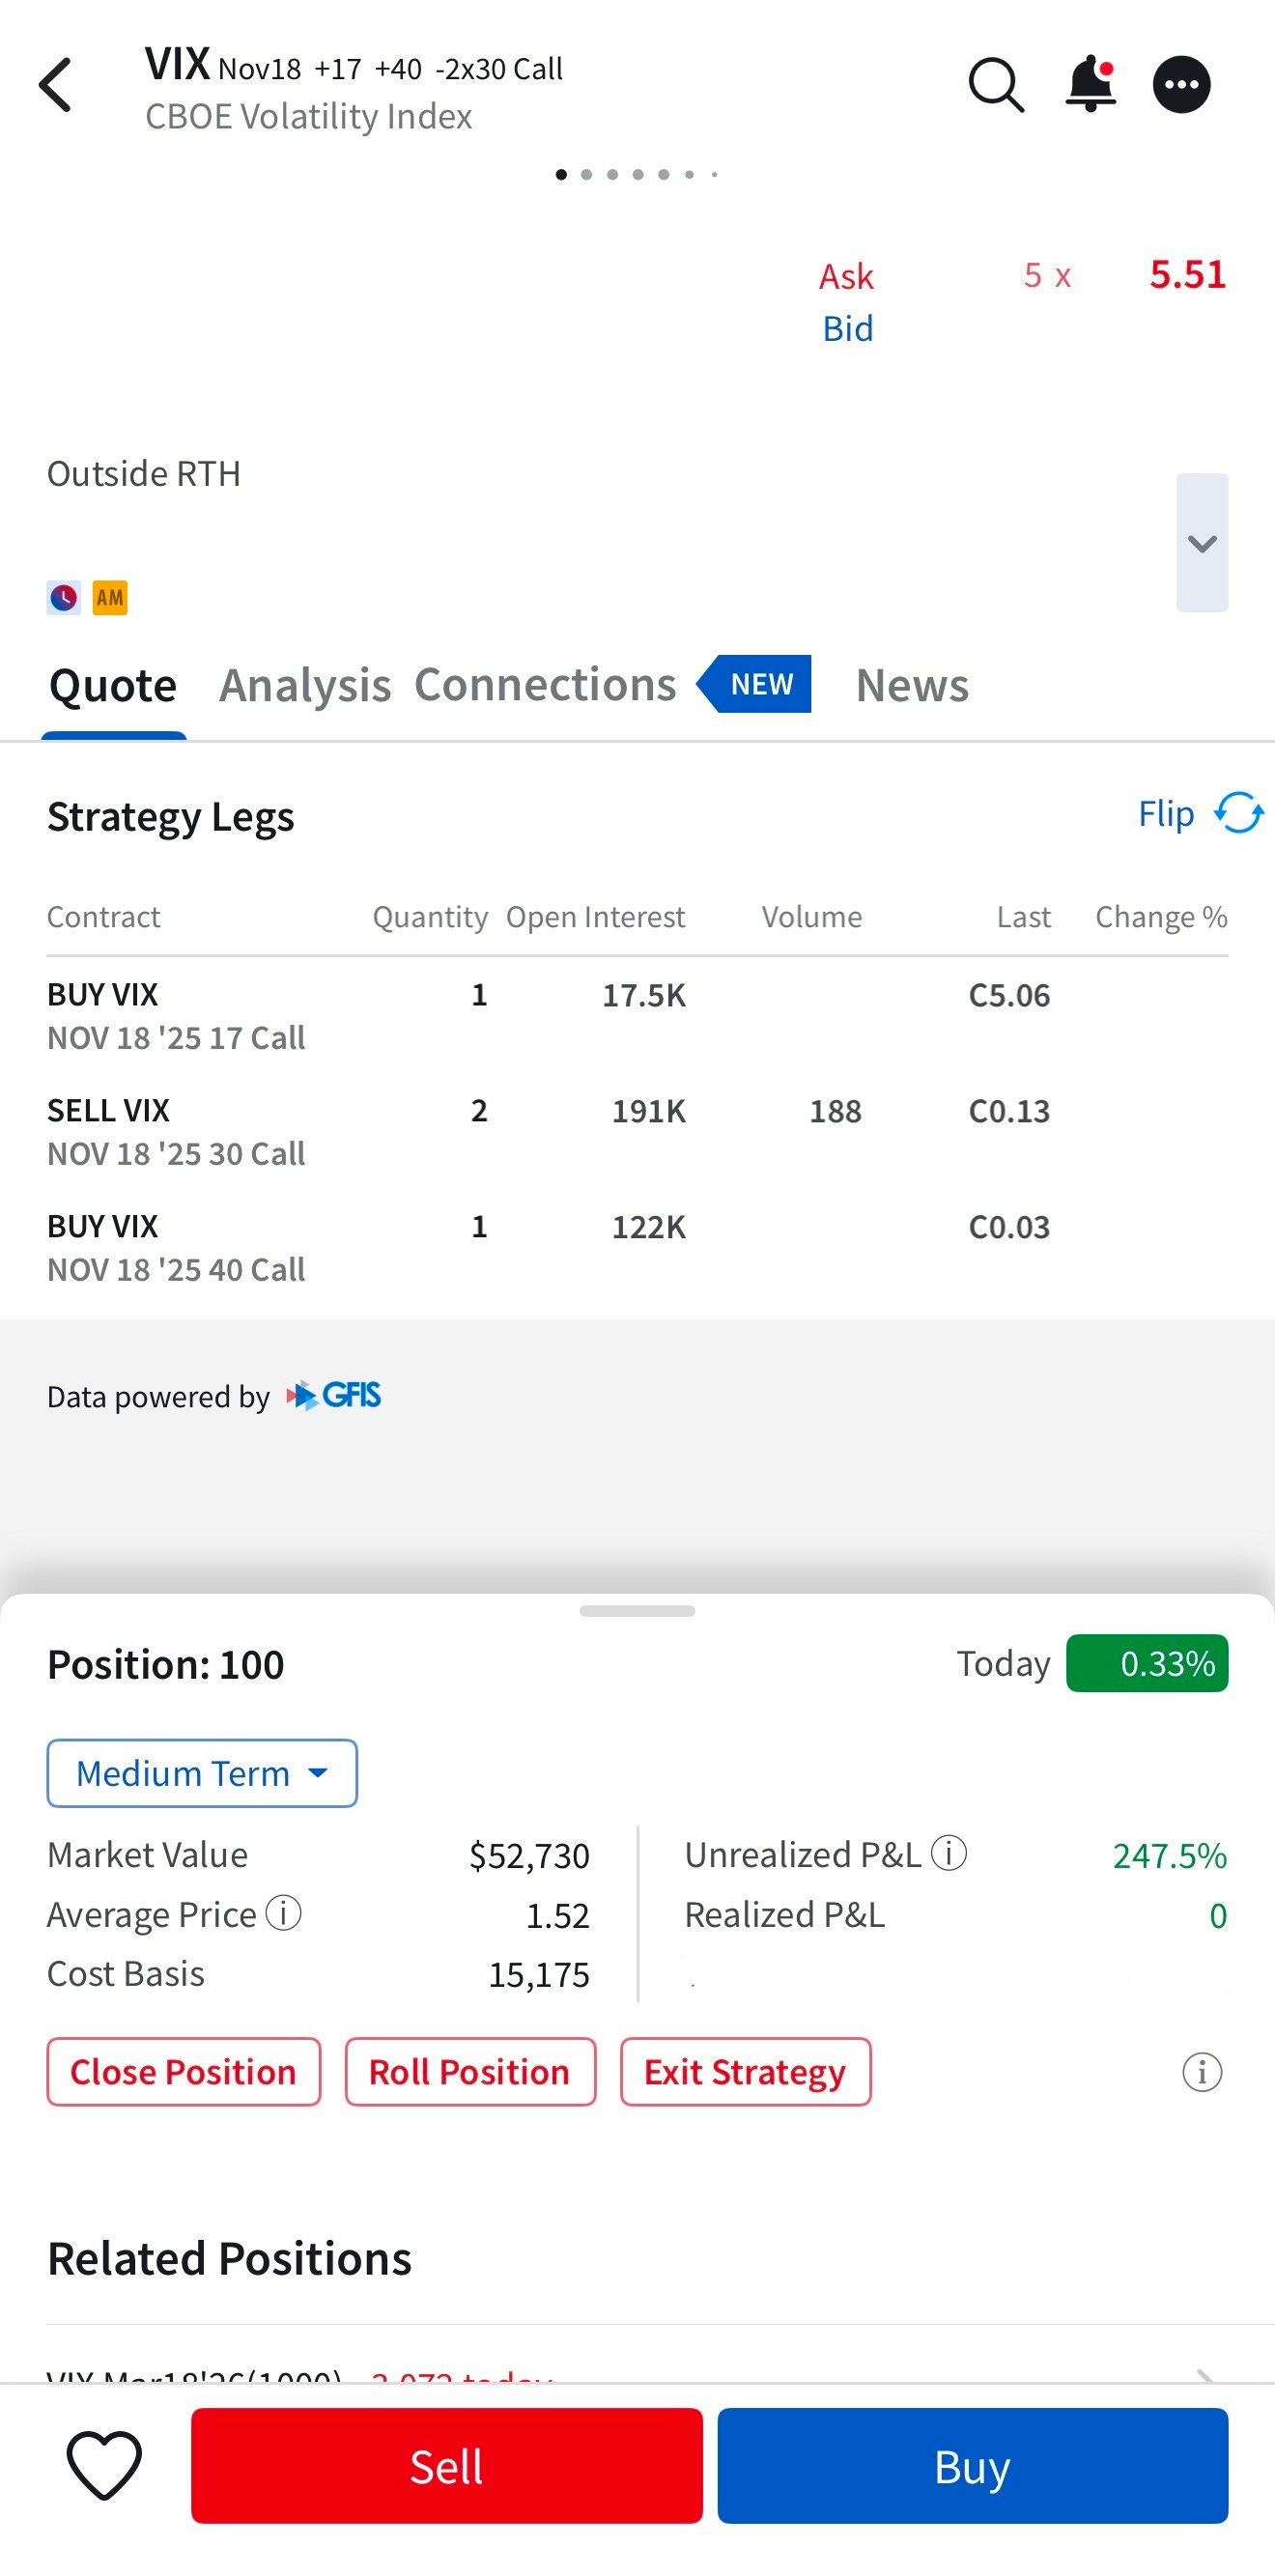
And the VIX call butterfly from the October 29 note is working beautifully and has hedged the December call ratio spread. It expires tonight.
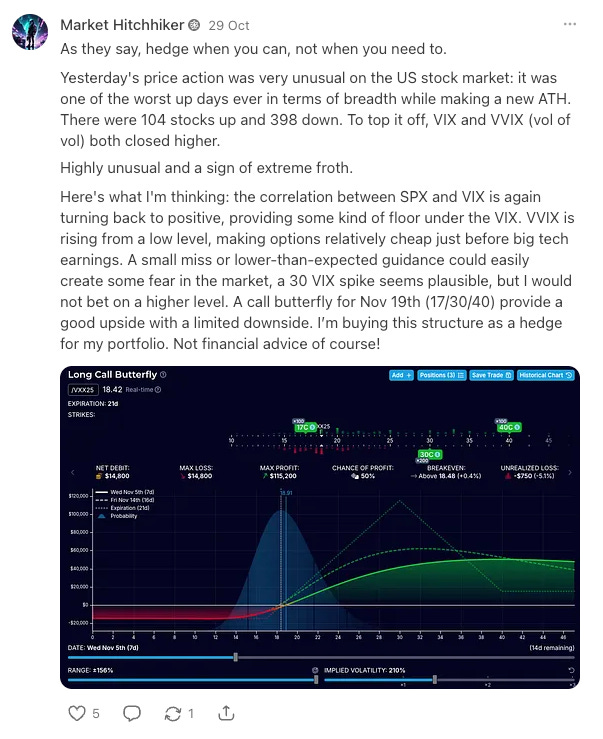
I opened the position for $15k; it is now worth $52k. That’s a cool 245% return on the premium.
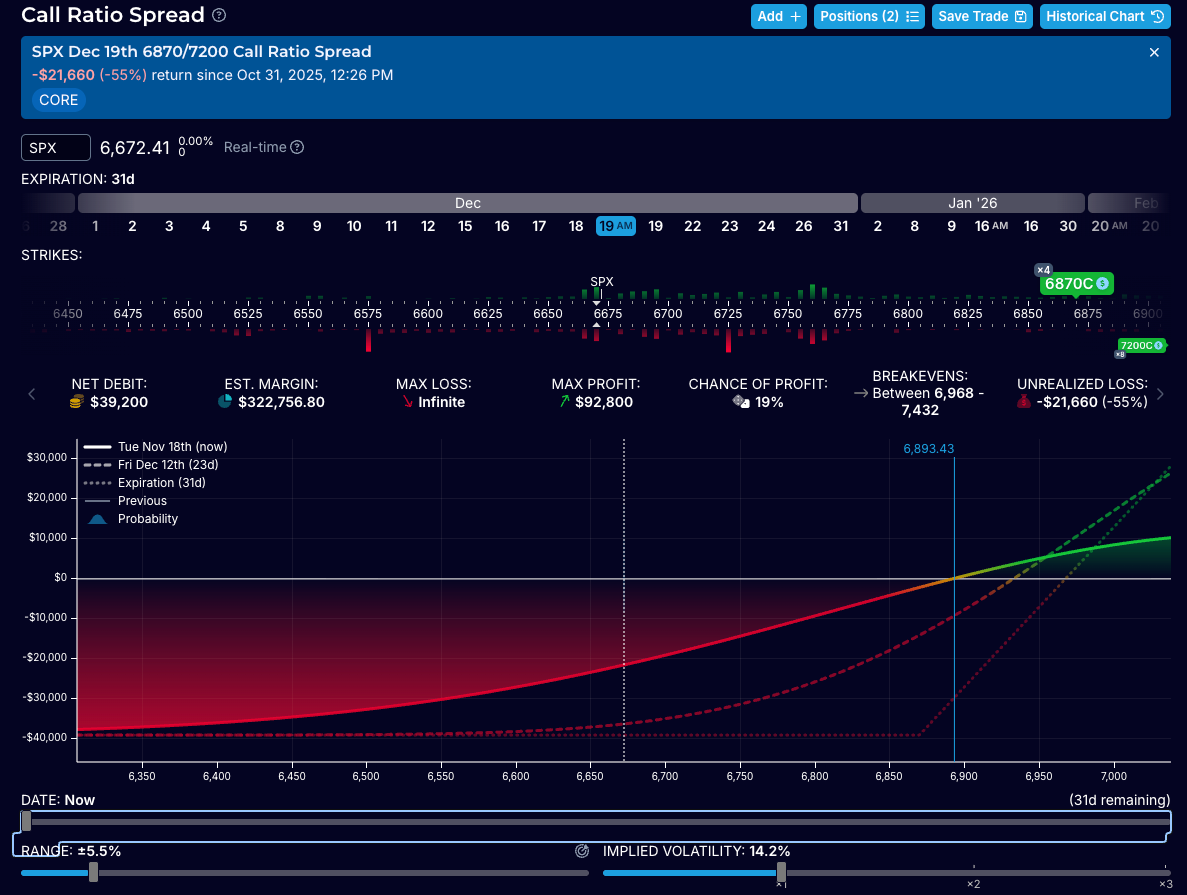
The call ratio spread is unfortunately under water, but the loss is only about half of what we made on the VIX call butterfly. We still have 30 days to expiry, and vega has helped buffer the drawdown a bit.
Let’s now review the market.
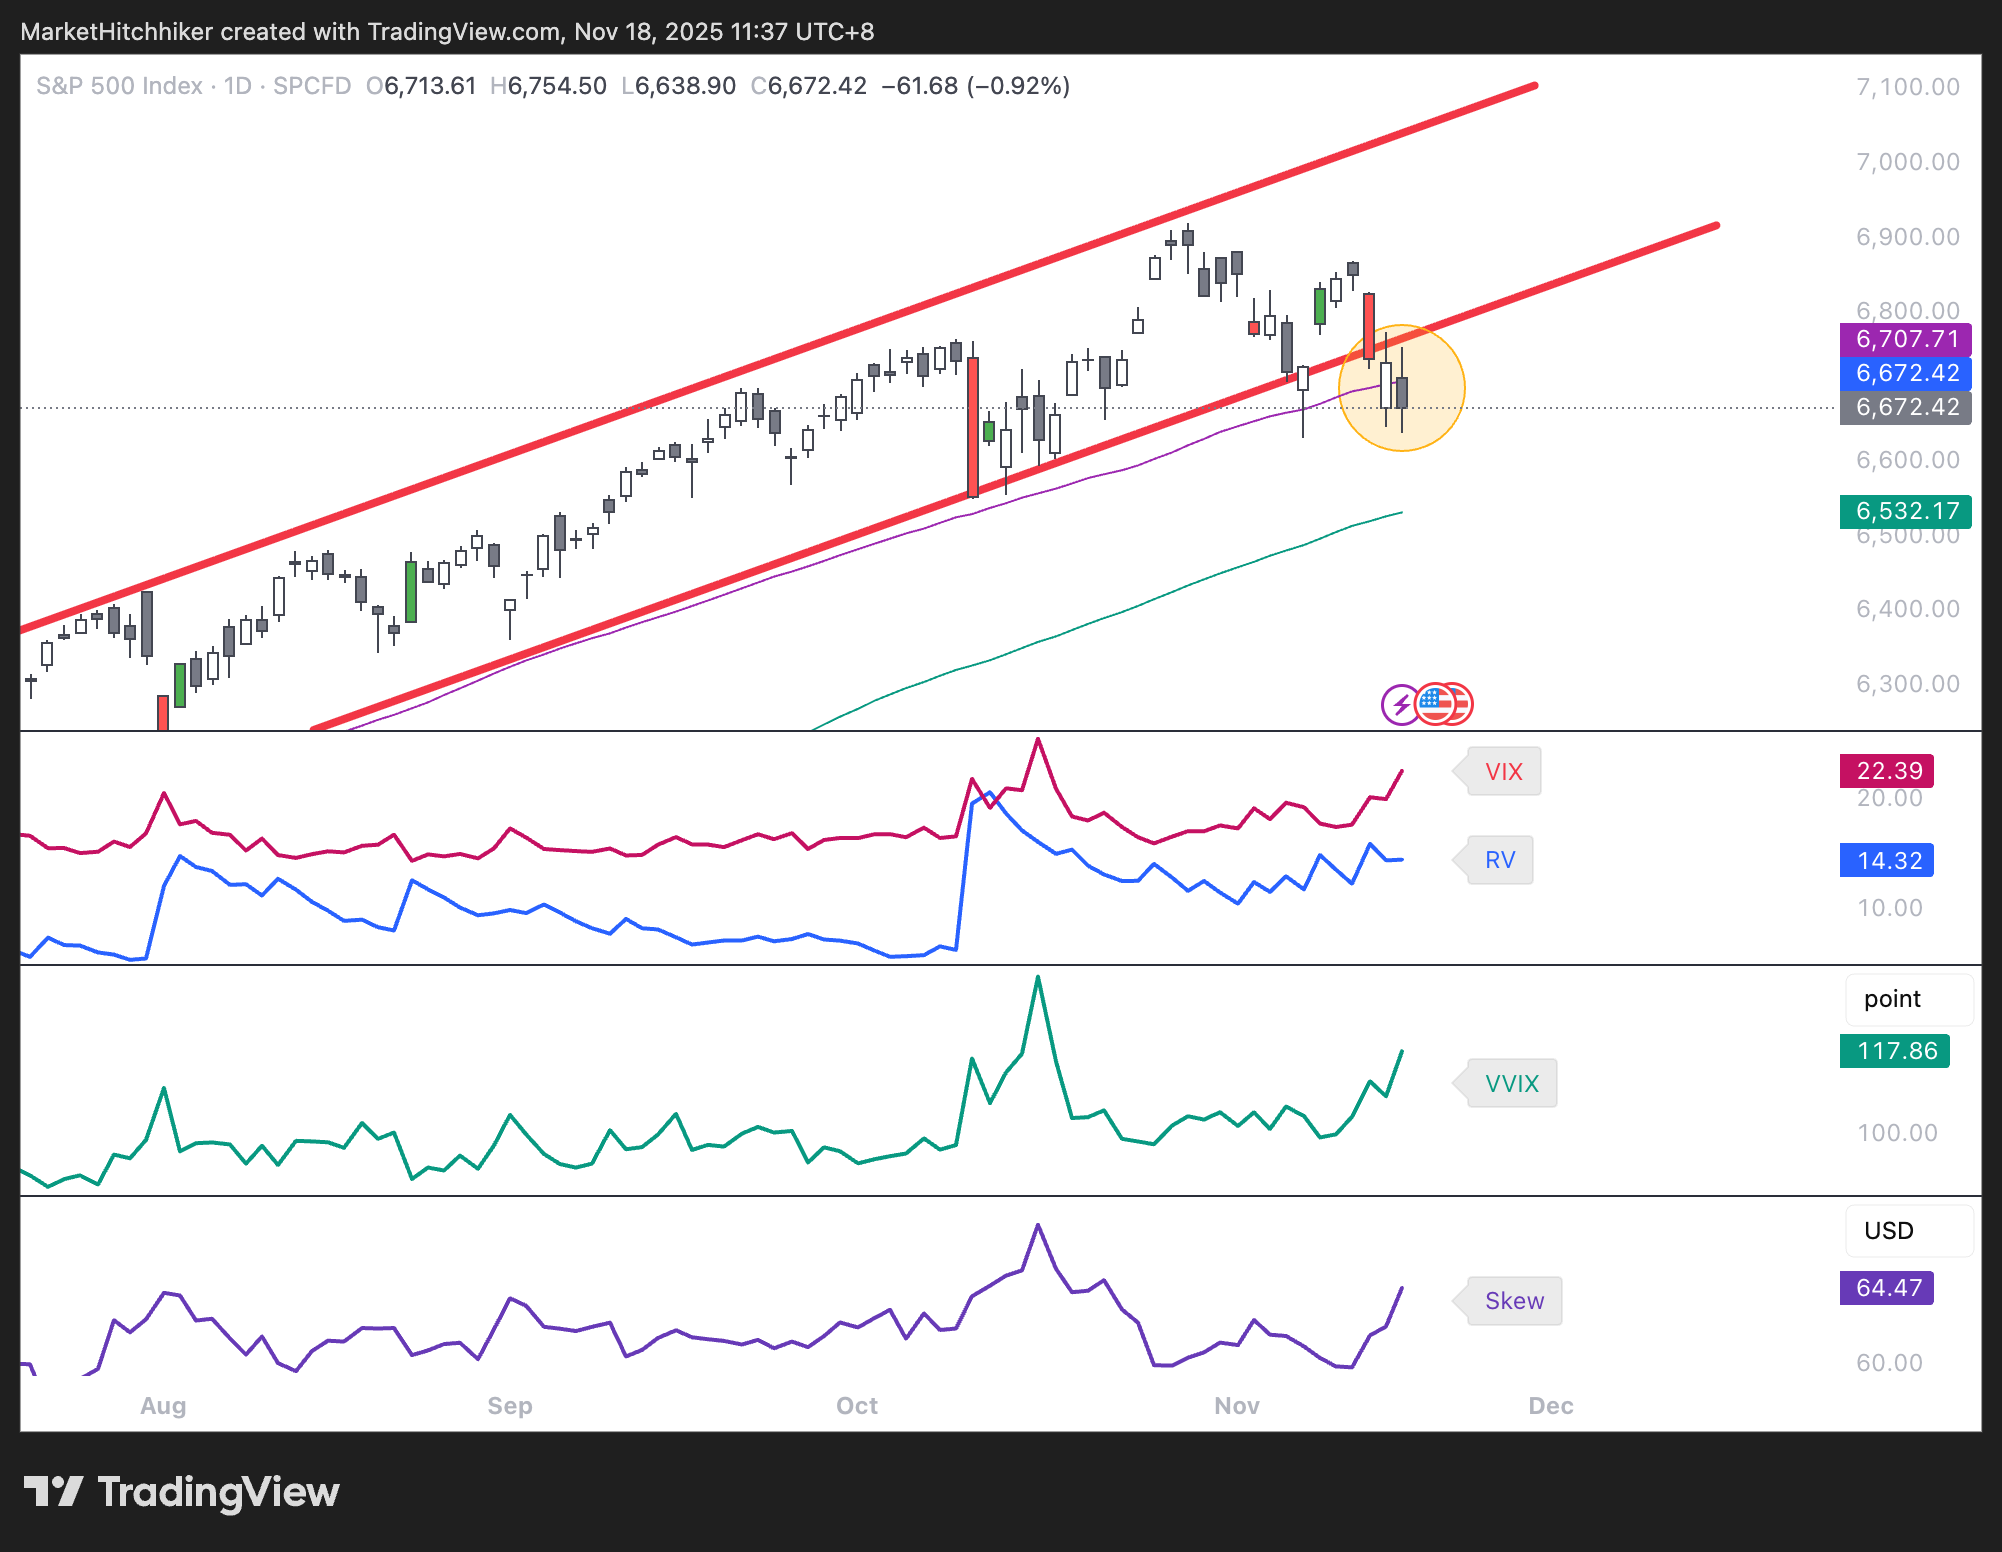
The chart has suddenly turned ugly. We retested the lower channel from below and have now lost the 50-day moving average. The real issue is less the break of support itself and more the fact that these levels held for so long while momentum has flipped to neutral. This marks a significant shift in market tone, especially coming right after major earnings disappointments from Meta and Palantir.
Meanwhile, the VIX, VVIX, and Skew have all been grinding higher. This is not yet a “spike,” so there is still no sign of short-term capitulation.
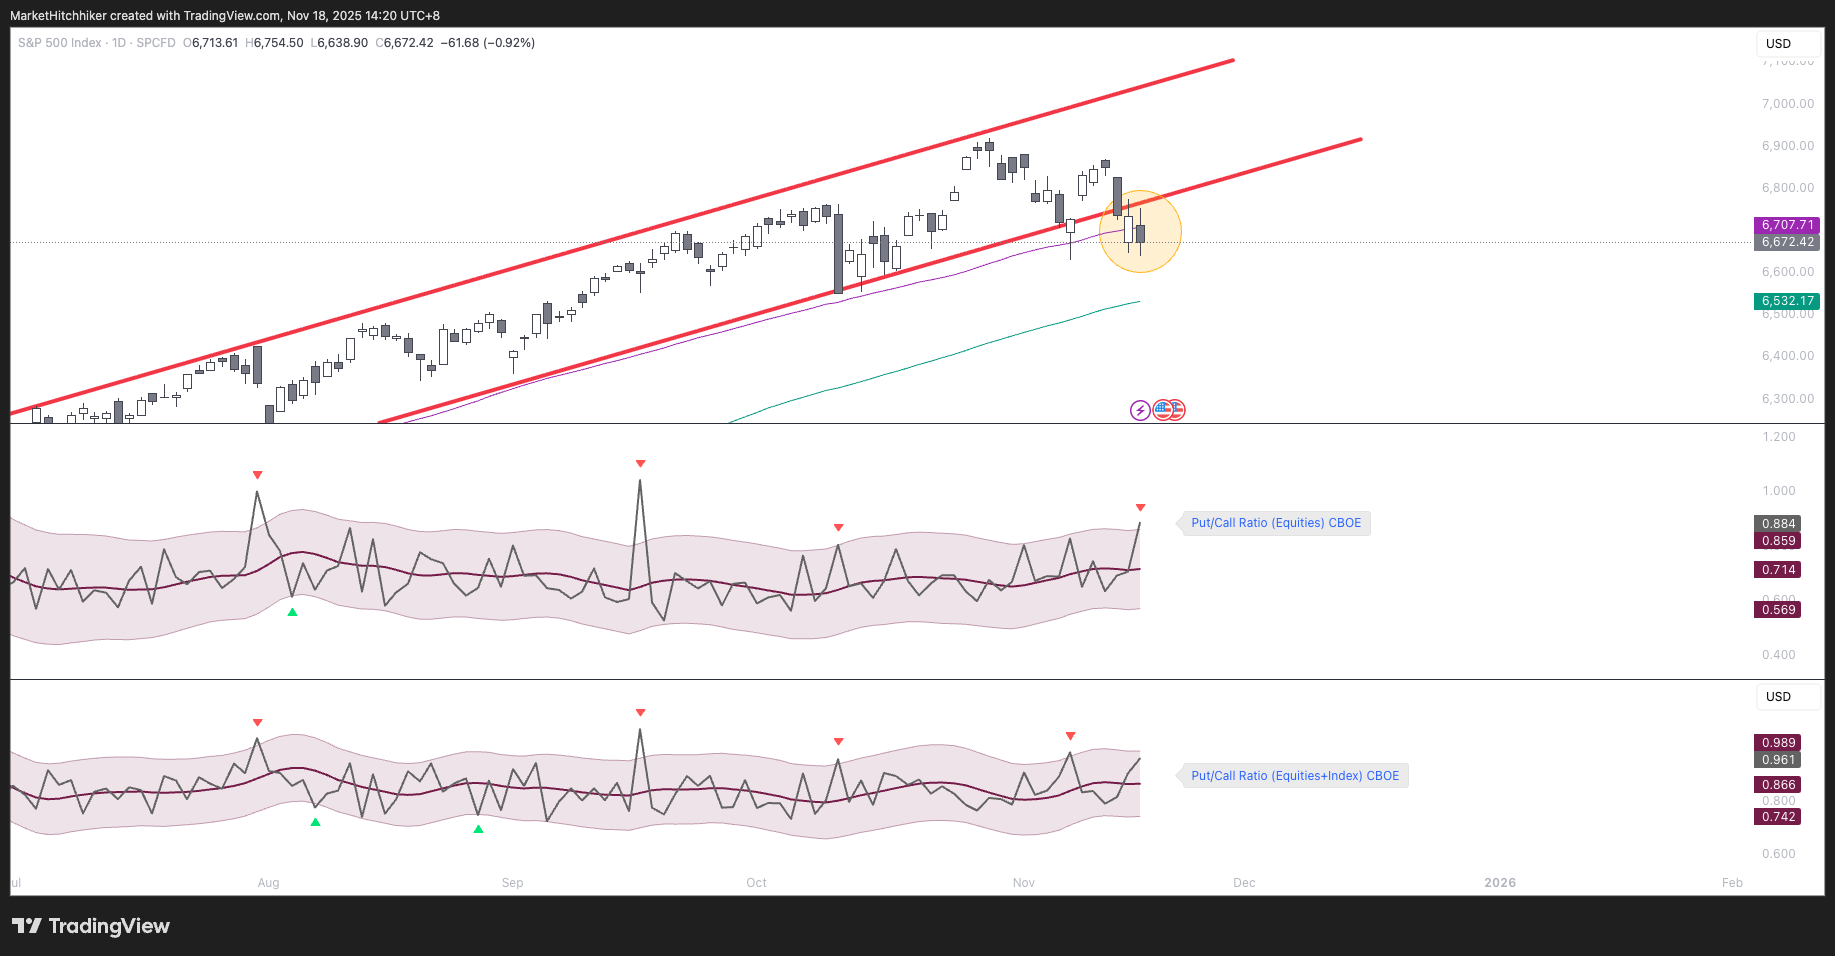
The put-to-call ratio has ticked higher, but still nothing that signals meaningful short-term fear.
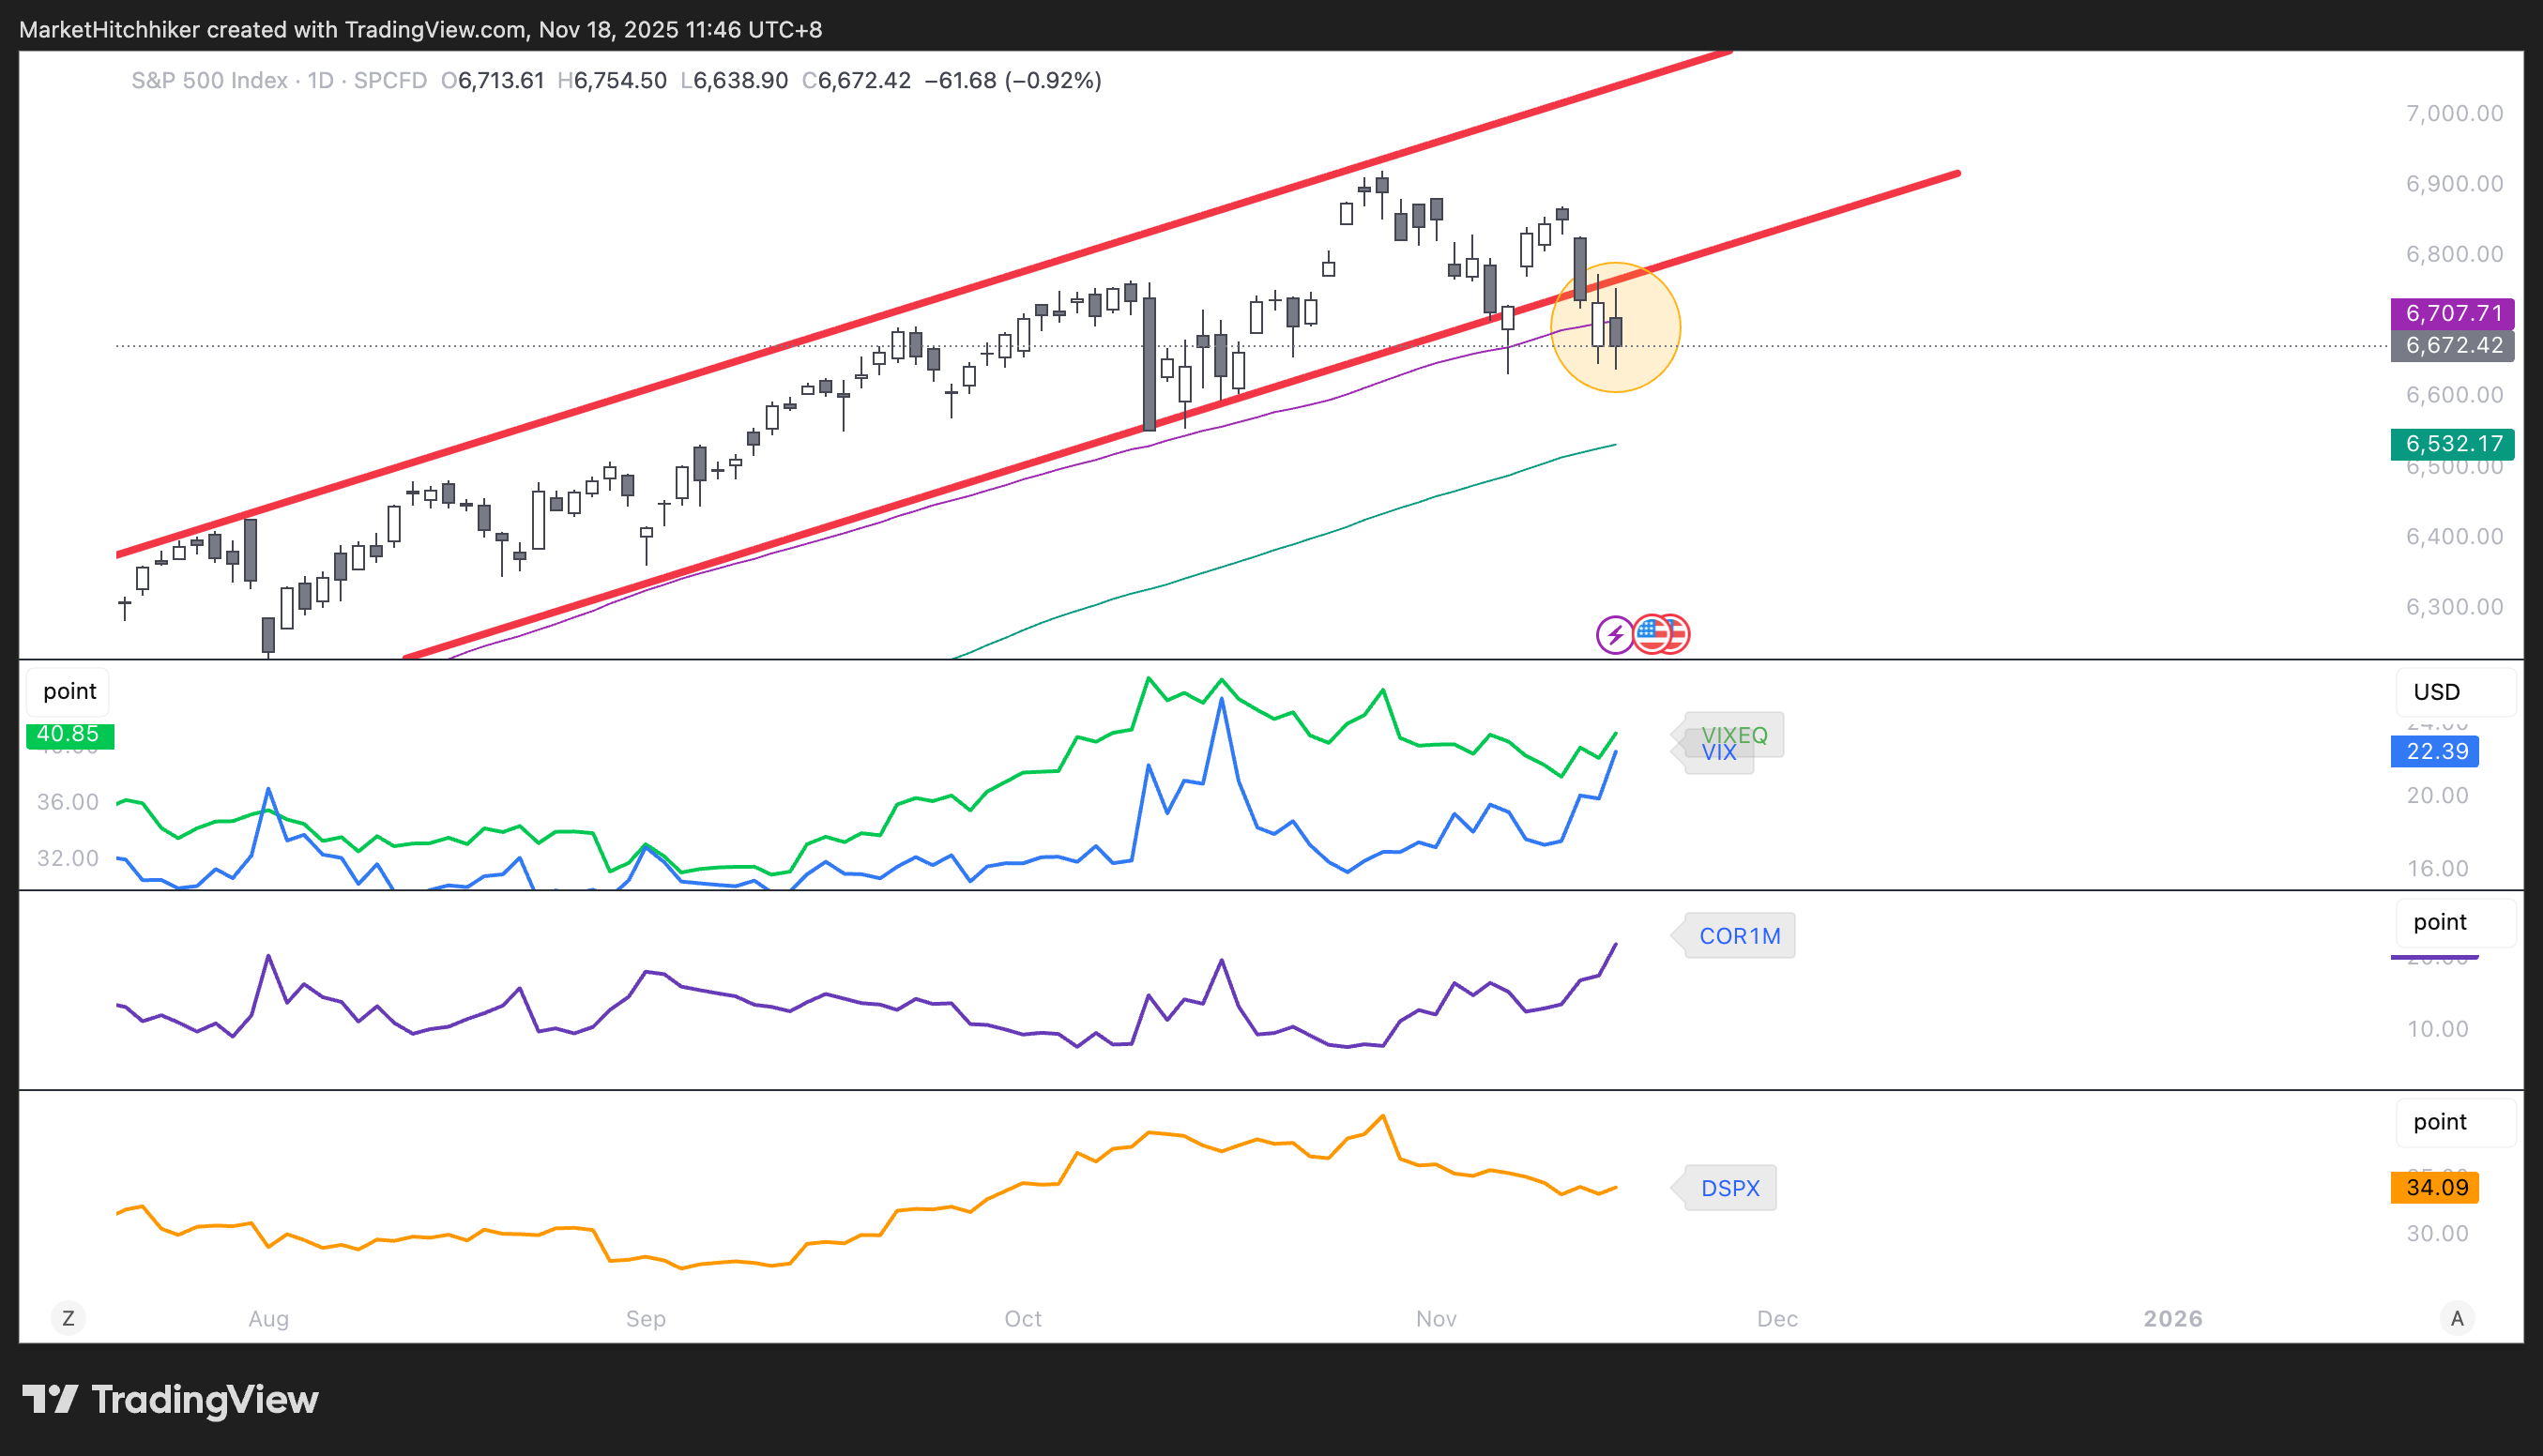
Dispersion continues to roll over (I explained the drivers behind this last week). It should persist at least until the jobs report. Meanwhile, correlation is hitting new highs. Risk has been steadily building.
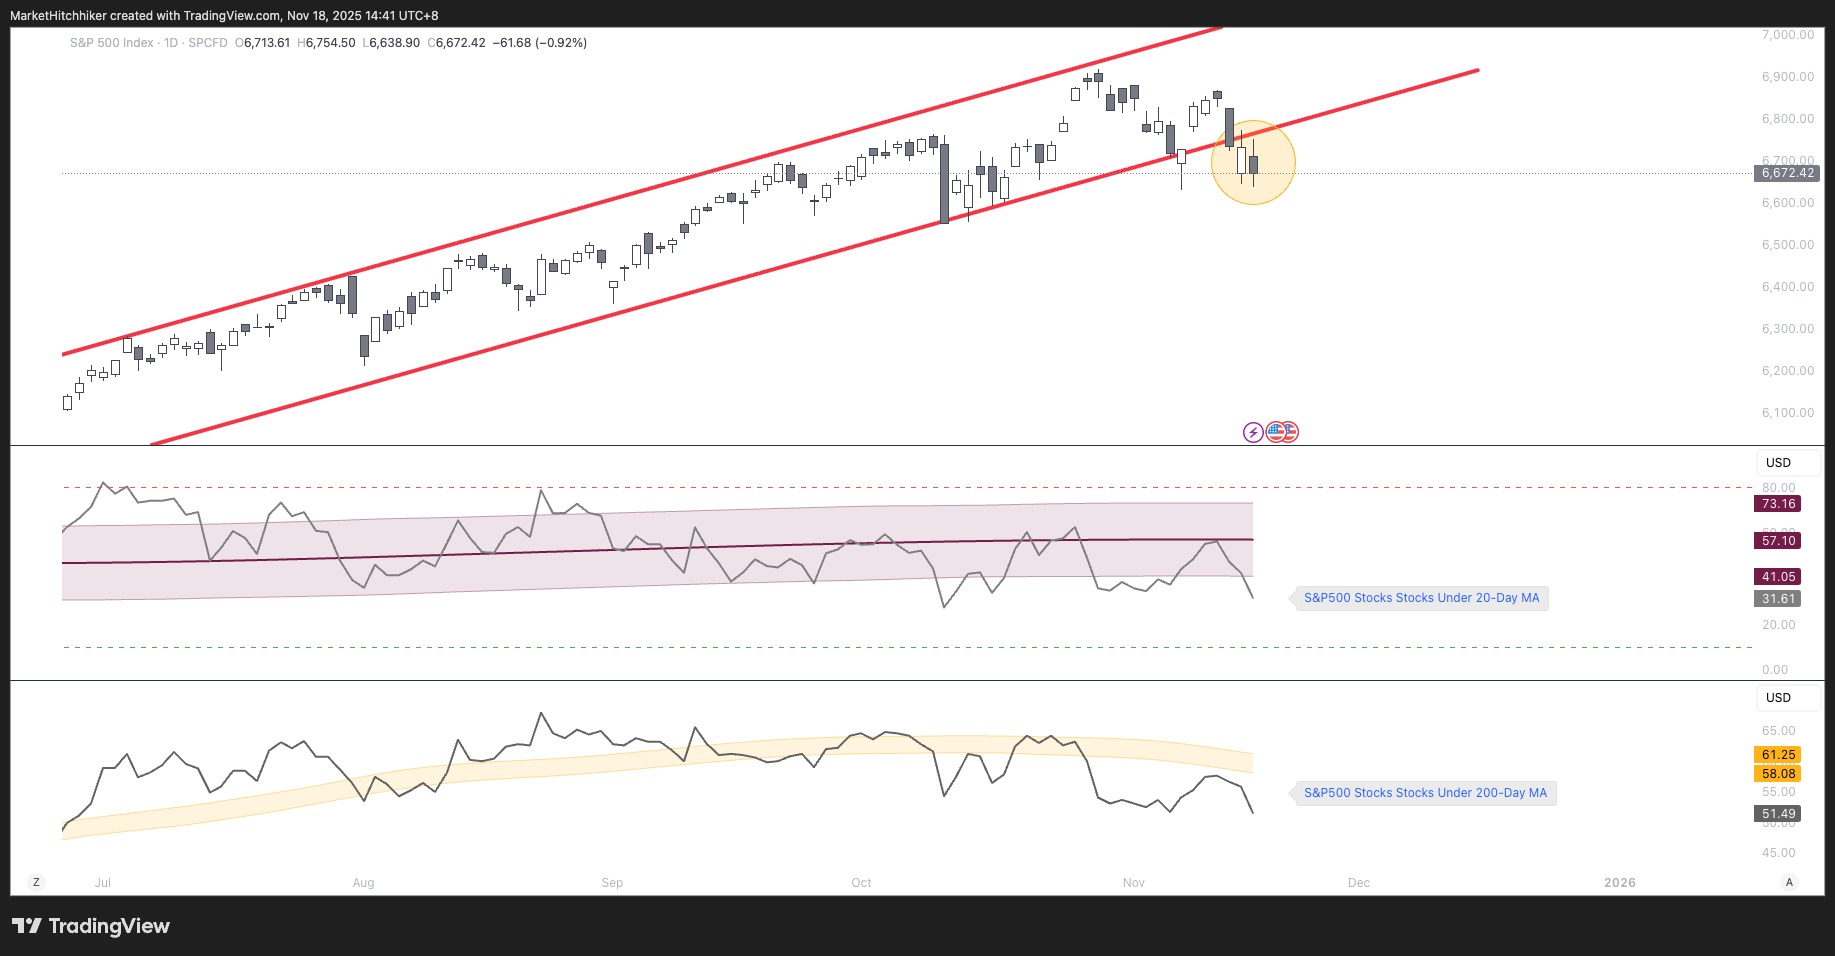
Breadth is also worrying. Long-term breadth has begun rolling over, while short-term breadth remains weak enough to cap momentum but not extreme enough to signal imminent short-term capitulation.
We remain risk-off. The risk/reward of buying this “dip” is poor. That said, this is a good time to take some profits on the SPX shorts and VIX longs. We will likely see a volatility crush on Thursday after the jobs report, and I’m fully expecting Papa Jensen to pump NVDA stock during tomorrow’s earnings call.
Watch for market reactions around these two events—NVDA earnings and the jobs report—then trade accordingly.
Good luck,
Market Hitchhiker