
Tactical Update on SPX
How deep can this correction be? All you need to know: cross-asset analysis, implied parameters, positioning & flow, sentiment.


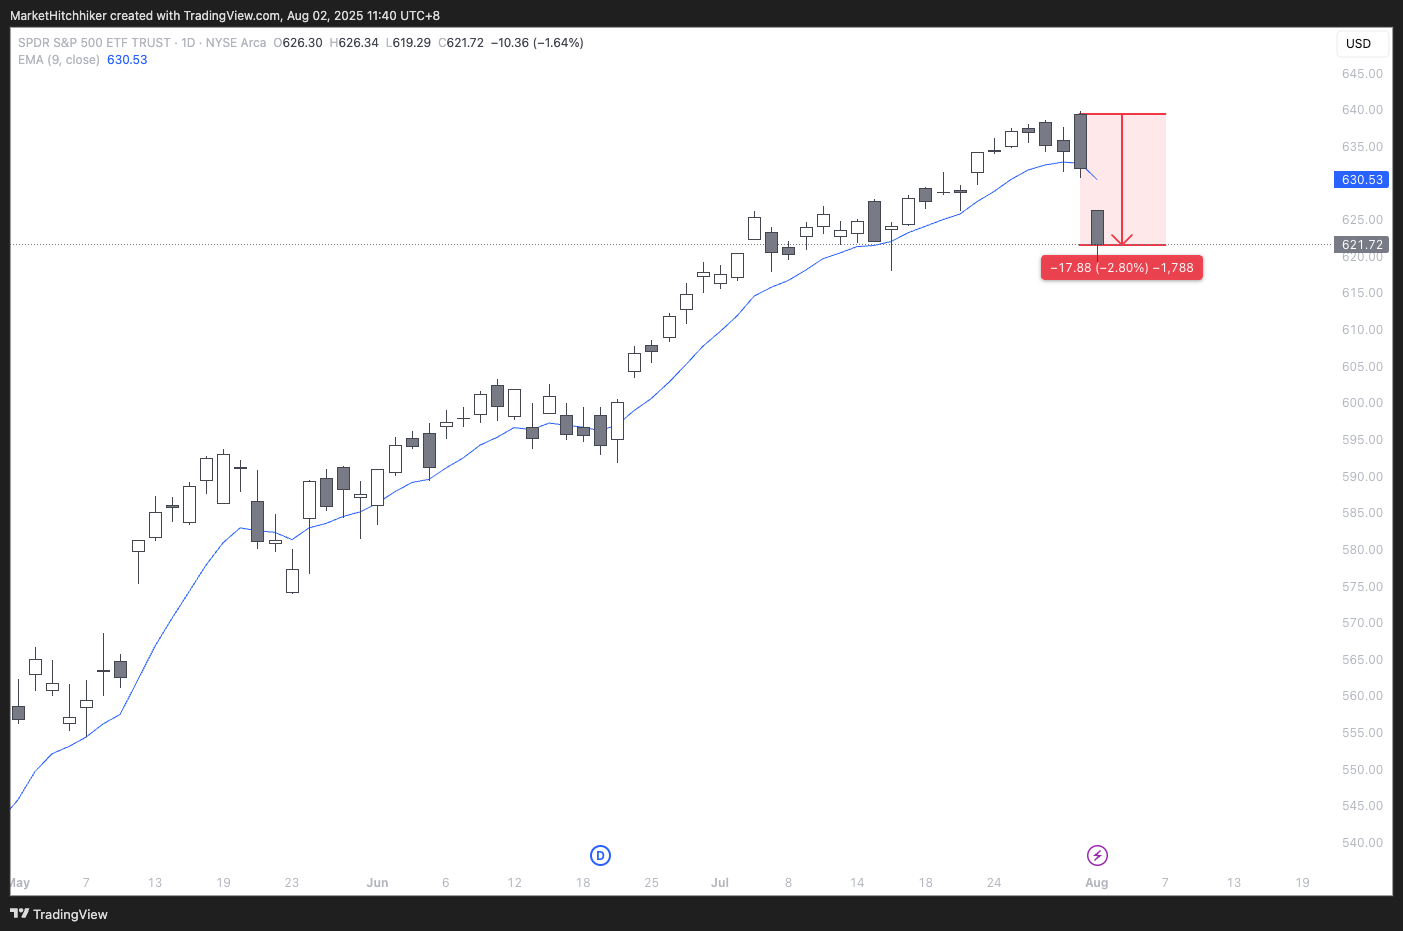
After 26 sessions without a move larger than 1% and a breathtaking rally, the S&P 500 finally showed signs of weakness:
July 31: After gapping up 0.50% at the open, the S&P 500 reversed all its gains and closed -1.15% lower. This occurred despite record earnings from Meta and Microsoft. Some might call it “profit-taking” or “news failure.” However, a bull market should rise on good news and shrug off bad news. This signals a change in character.
August 1: Bad news hit the tape with Trump imposing new tariffs and a very weak NFP report. The S&P 500 closed -1.64% lower. The “buy the dip” crowd was absent.
Overall, we’re in a -2.80% drawdown over two days. It may seem minor, but it could mark the start of a deeper correction. Let’s examine my favorite indicators to gauge the potential depth of this correction, covering cross-asset analysis, implied parameters, positioning and flow, and sentiment.
1. Cross-Asset Analysis
This correction in the US stock market isn’t happening in isolation. A move in equities should be confirmed (or contradicted) by correlated moves in other asset classes. These collective moves help us infer what the market is pricing in. The driving force behind asset repricing is new information, leading to a new equilibrium that reflects the market’s view of a potential new environment or the probability of entering, continuing, or exiting one.
For those following me from the start, you know I map the market into four regimes: Goldilocks, Reflation, Stagflation, and Recession. The table below estimates the current regime based on trailing performance across asset classes and equity sector analysis.
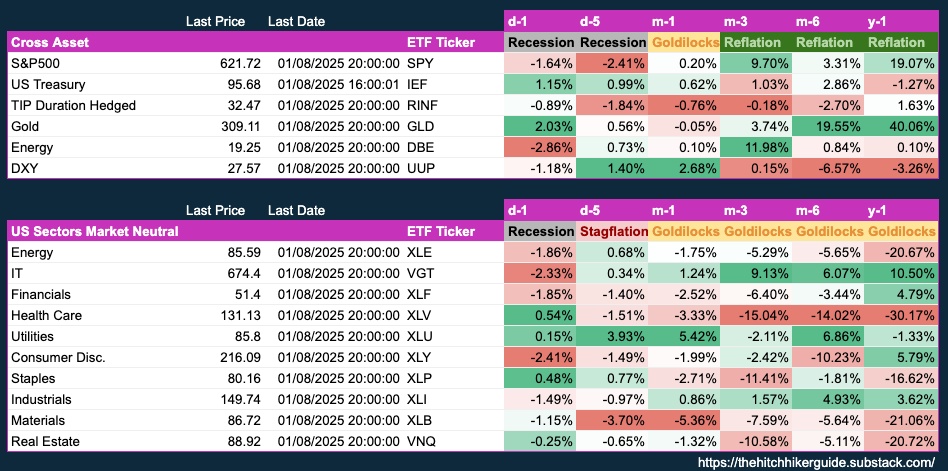
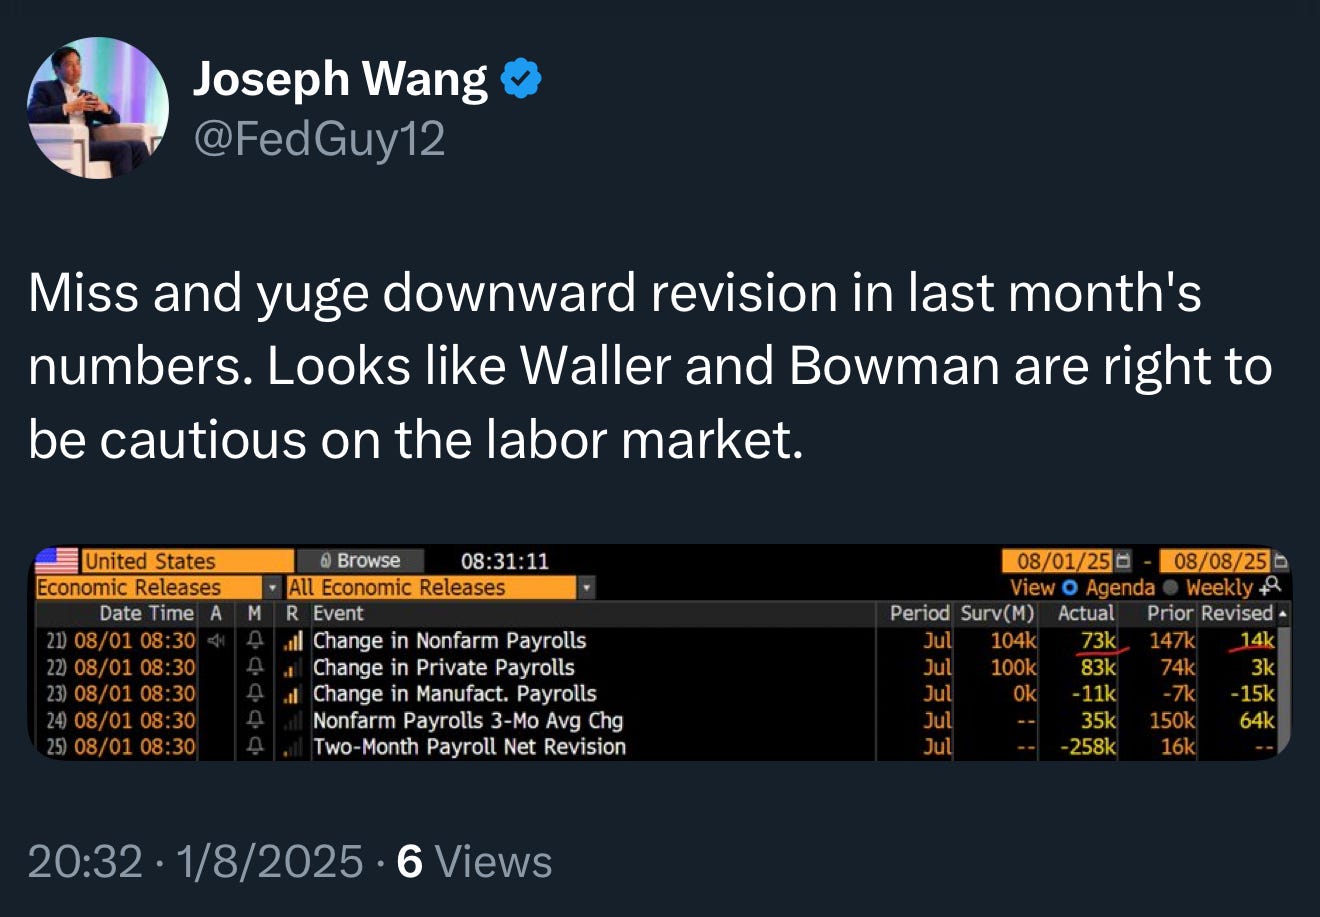
The emerging regime is Recession. This aligns with growing market concerns about the job market after significant negative revisions to NFP numbers. A slowing job market suggests slower growth and likely lower inflation due to reduced consumer demand. The Fed hasn’t cut rates due to uncertainty around tariffs and their impact on inflation. The market is shifting from pricing loose financial conditions to very tight ones, with a rate cut now expected in September.
US Equities down, US Treasuries up, Inflation-Protected Bonds down, Gold up, Energy down, and Dollar down—this suggests the market is pricing in a recession.
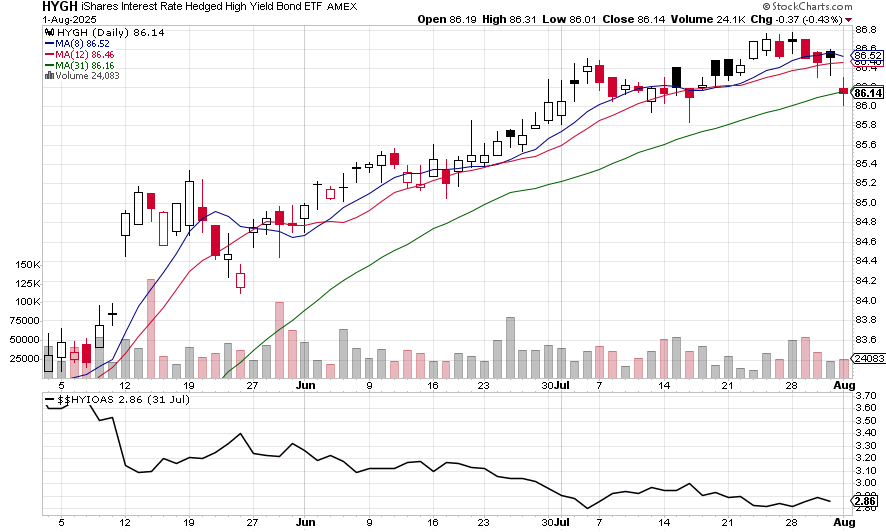
Credit spreads are at all-time lows, so I’ll be closely monitoring HYGH in the coming days. We’ve lost some short-term moving averages, confirming the potential for a larger move. I bought a few put options on HYG yesterday (not HYGH due to low liquidity), as implied volatility (IV) is cheap and the risk/reward is compelling.
Interestingly, HYG’s implied volatility remains low, while flow and positioning are turning bearish, as evidenced by Open Interest and Option Volume:
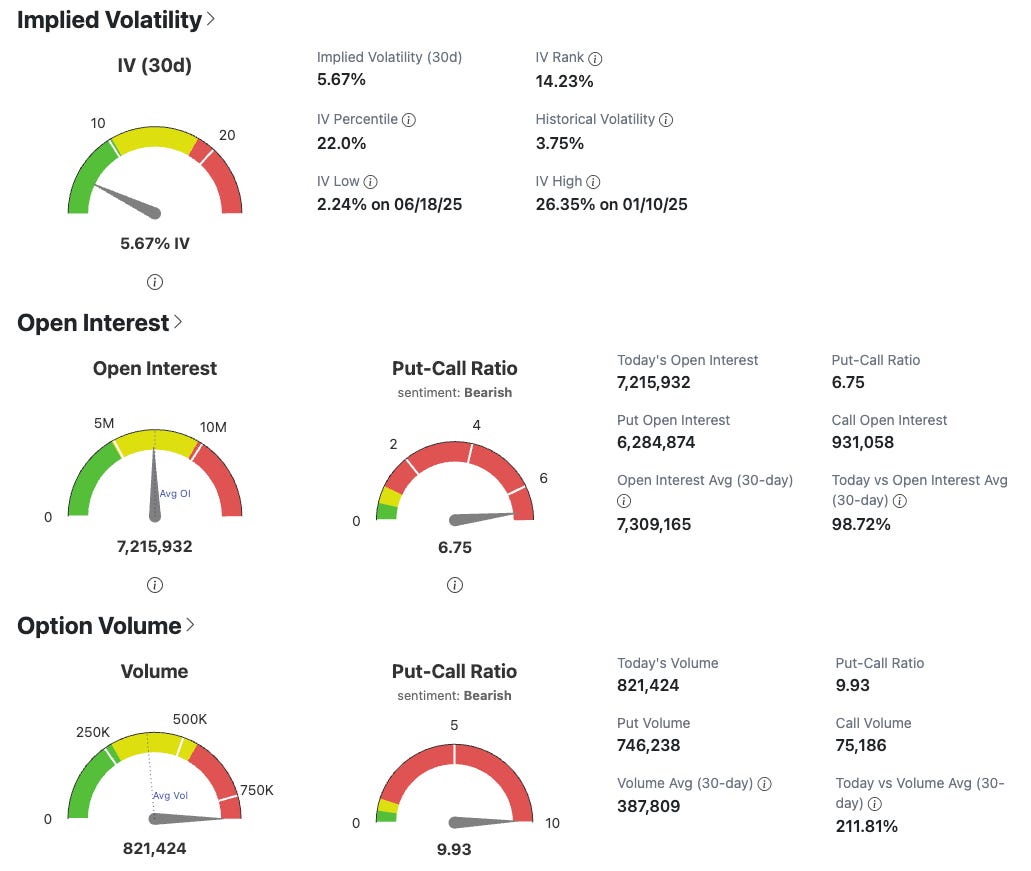
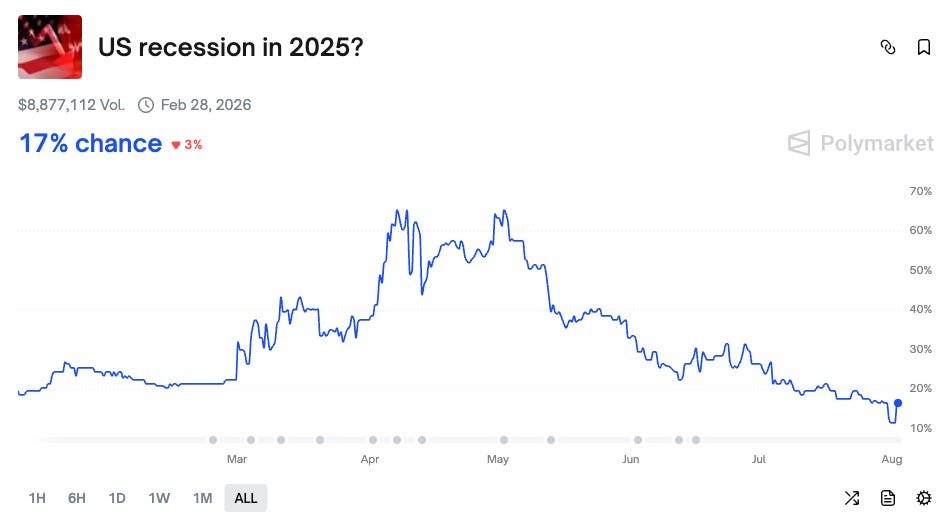
This cross-asset analysis confirms the S&P 500’s move. The correction stems from an underpriced recession probability. Notably, Polymarket has barely adjusted its recession odds. My conclusion: this correction is macro-driven, repricing recession risk, and likely has room to run.
2. SPX Implied Parameters
I’ll examine the following:
VIX: No introduction needed—if you don’t know it, why are you reading this?
VVIX: Implied volatility of the VIX (implied VoVol).
VIX-VIX3M: The term structure of the VIX, i.e., the difference between 1-month and 3-month option IV.
COR1M: Implied correlation between S&P 500 stocks, measuring how closely assets move together (ranges from -1 to 1).
DSPX: Implied dispersion, measuring how much individual stock returns within a group (e.g., index or sector) differ from the group’s average. High dispersion indicates diverse performance; low dispersion means similar movement. During sector rotation, dispersion is often high due to uneven capital flows. Correlation depends on specific relationships—stocks in the same sector may have low correlation if diverging, or sectors may have high correlation with the market if the trend is strong. A technical crash (e.g., Volmageddon 2018) typically shows high correlation and low dispersion, while a macro-driven bear market has high correlation and high dispersion. A sector rotation, like earlier this year due to tariffs, shows low correlation and high dispersion.
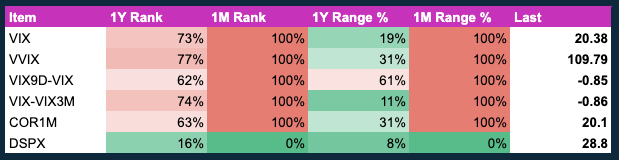
A quick look at ranks and ranges in the table below provides a snapshot. Most indicators (except DSPX) have hit elevated levels, maxing out the 1-month lookback—not surprising given the market’s low volatility during its prior uptrend. However, there’s still upside potential on a 1-year lookback, which includes Liberation Day.
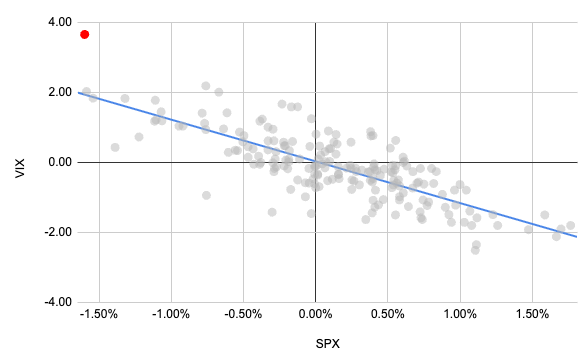
Yesterday’s VIX move was extreme, overshooting the trendline between SPX and VIX moves. Should you fade it? I wouldn’t—it’s too early in the correction. This is an initial warning shot, urging traders to reduce risk.
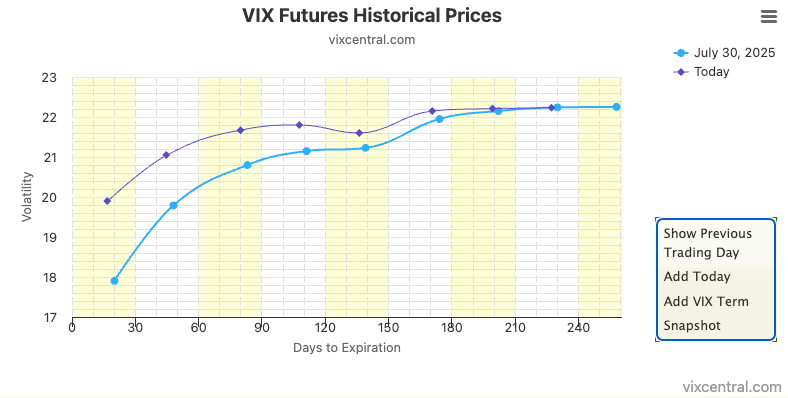
The VIX futures term structure has repriced higher at the front end, but we’re far from max fear. The front-month contract trades below the second and third contracts, indicating fear isn’t fully priced in yet.
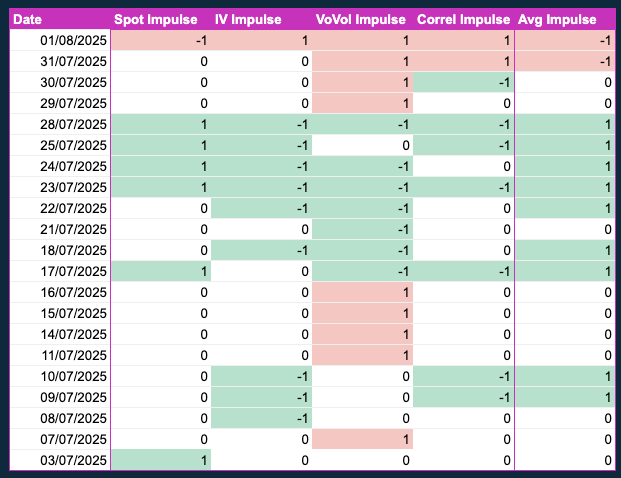
The VoVol (VVIX) has been creeping higher for four days, an early correction signal. The table below shows my “Impulse” indicator for key implied parameters. The Impulse, valued at -1, 0, or 1, signals momentum shifts based on the last close and two moving averages (see Elder Impulse System for details).
VoVol was the first warning, followed by correlation two days ago, confirming the risk-off move. This is the first time in a while all four impulses are negative, following a long stretch of neutral or positive impulses. It’s too early for this correction to end—I’d want to see neutral impulses indicating exhaustion.
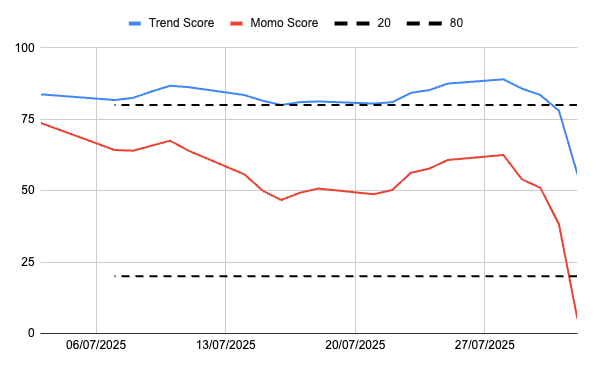
Using implied volatility, VoVol, and correlation, I’ve built an oscillator to track S&P 500 trend and momentum, ranging from 0 to +100. When momentum falls below 20%, we enter a RISK-OFF regime. Typically, the trend score follows, converging toward 0. This signals more downside potential.
I believe risk-off assets like the VIX follow a Hawkes Process, requiring sustained self-excitement to keep rising; otherwise, it deflates.
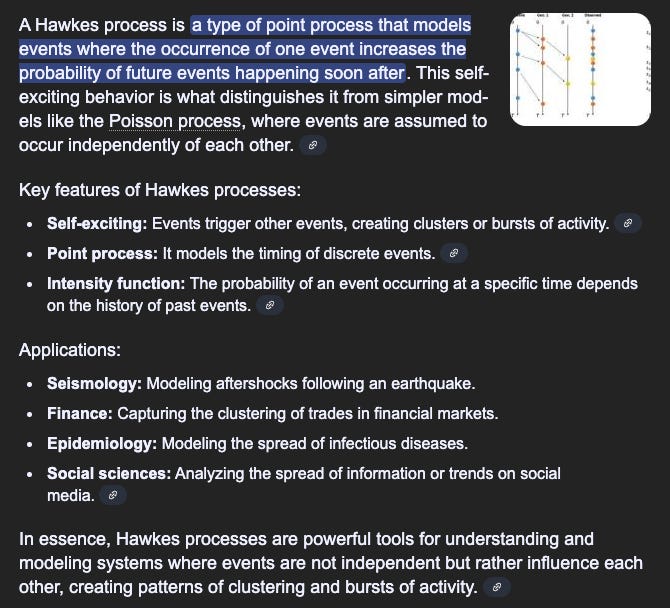
If it feels reminiscent of a Ponzi-like asset, such as a crypto sh*t-coin, that’s entirely normal.

The chart below shows 4-hour candlesticks for the VXX ETN, which tracks a rolling VIX futures strategy. I prefer VXX because it trades only during US hours (unlike VIX futures), has constant maturity, and offers clearer volume and volatility signals. My custom indicator tracks the Hawkes Process, with the “self-exciting” feature active (green line) above a threshold. We’ve entered this self-excited regime.
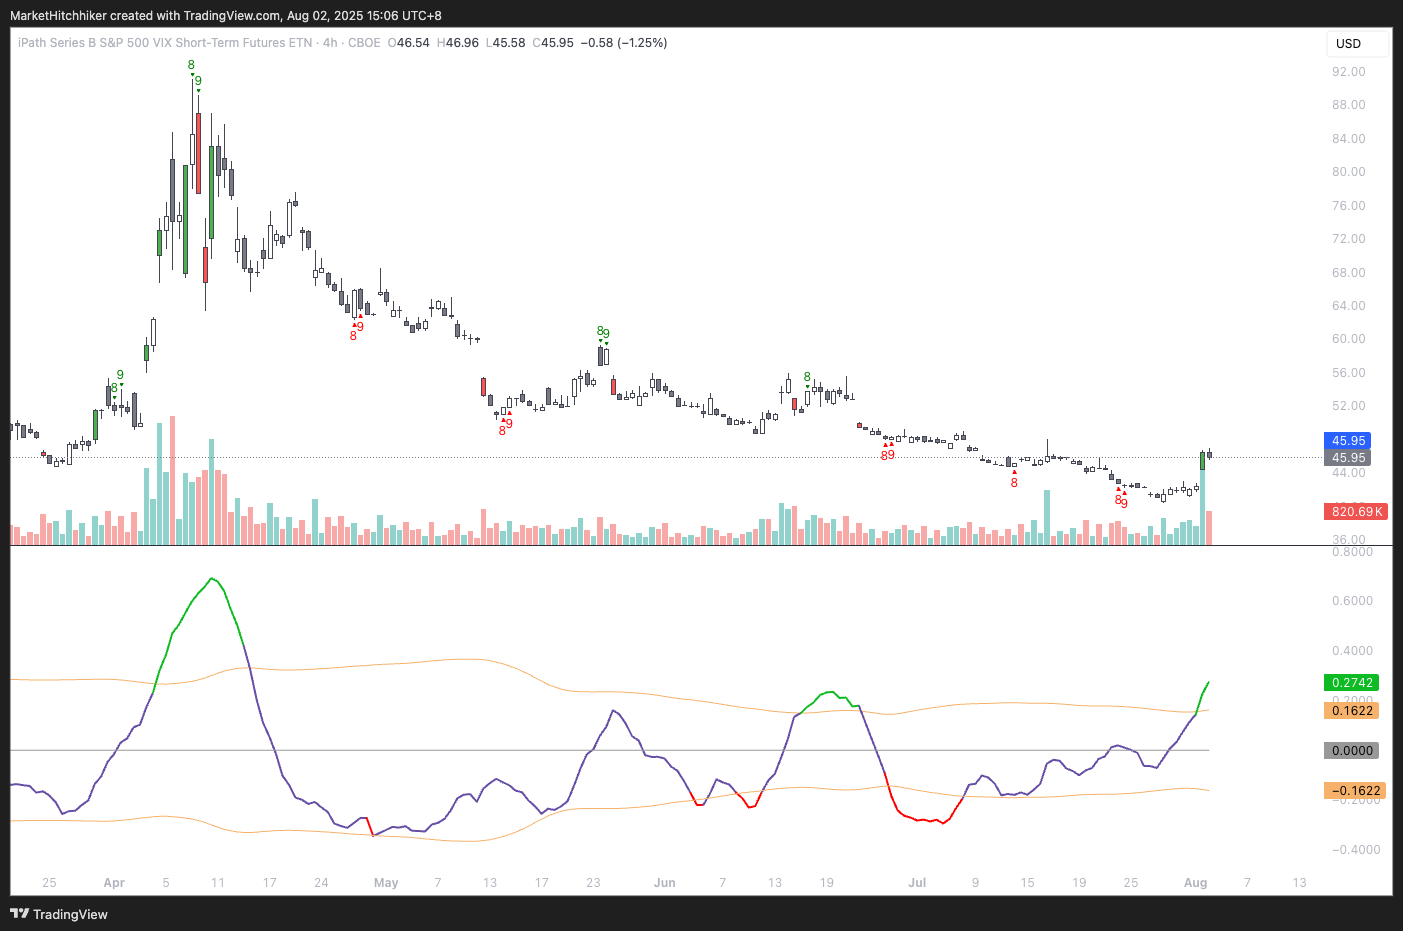
Conclusion: Implied parameters show maximum momentum with no signs of exhaustion. When a correction follows a Hawkes Process, fading it while self-excitement is active is risky. Implied volatility, VoVol, and correlation are in a positive momentum phase—don’t stand in the way. However, DSPX (implied dispersion) has ticked down, suggesting a technical correction rather than a macro-driven bear market. This contradicts somehow the cross-asset analysis, indicating the correction may be an exhaustion of the prior bullish move rather than a new bear market. This suggests a sharp downside move where buying the dip could eventually make sense. Keep monitoring dispersion.
3. Positioning & flow
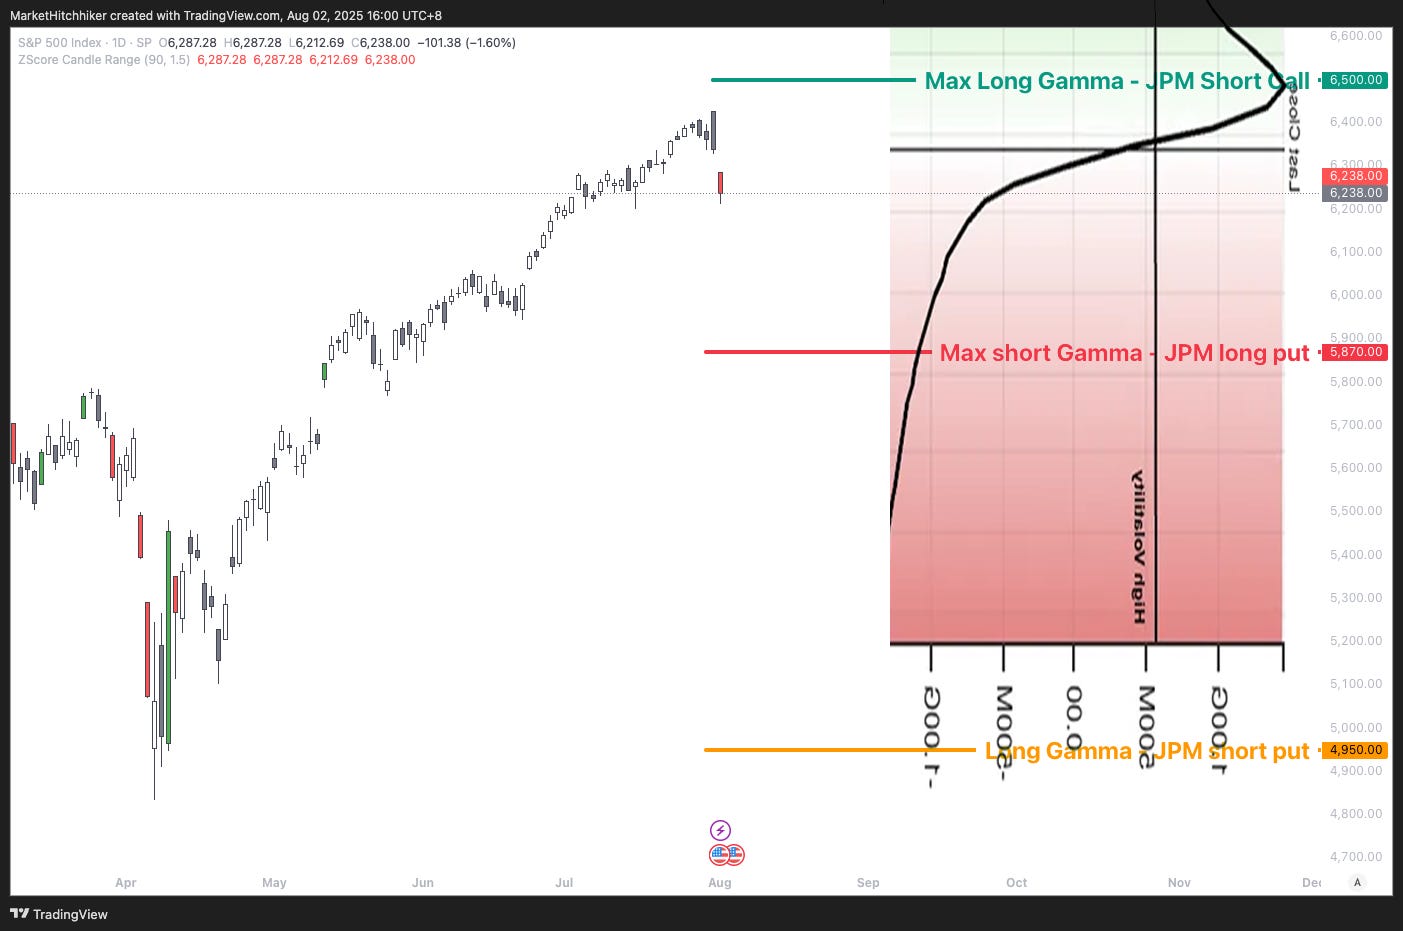
Let’s start with gamma positioning. Key levels:
Upside long gamma at 6500: This is where JPM’s collar short call sits, expiring end of September. We’ve exited this zone’s gravitational pull. Volatility can be set free!
Downside gamma: Max acceleration diminishes toward 6100. JPM’s long puts are at 5870, with short puts at 4950.
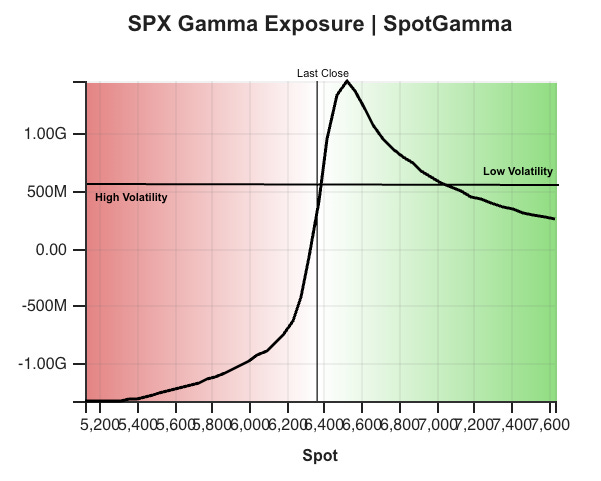
The chart below should be very helpful, overlaying gamma with the candlestick chart. If we follow the same playbook as the March correction, the market may accelerate toward the JPM Collar long put at 5870—our first target.
Should this correction turn into a complete rout, the next target is 4950. This isn’t my base case, but let’s keep an open mind. The market has a peculiar tendency to crash both upward and downward, driven by “negative gamma” systematic strategies like CTAs, Vol Control funds, Collar ETFs, and the general tendency for traders to chase momentum.
The real target might be where Trump triggers a “TACO” :) Markets stop panicking when policymakers panic. This “Trump Put” likely sits around 5500. However, a strong bid in the Treasury market could delay the TACO trade, offering a window for Bessent to term out the debt.
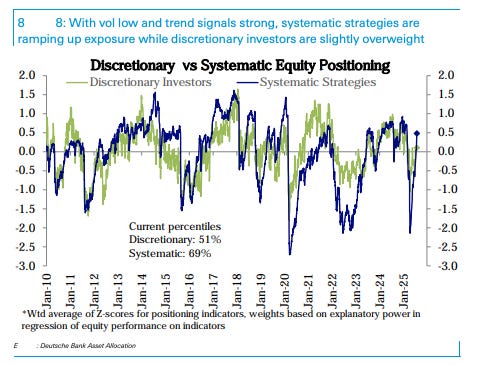
Systematic flow and positioning: Per Goldman Sachs and Deutsche Bank, most systematic strategies are at high exposure
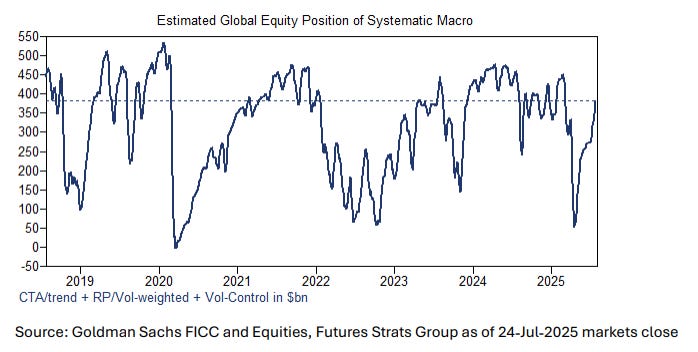
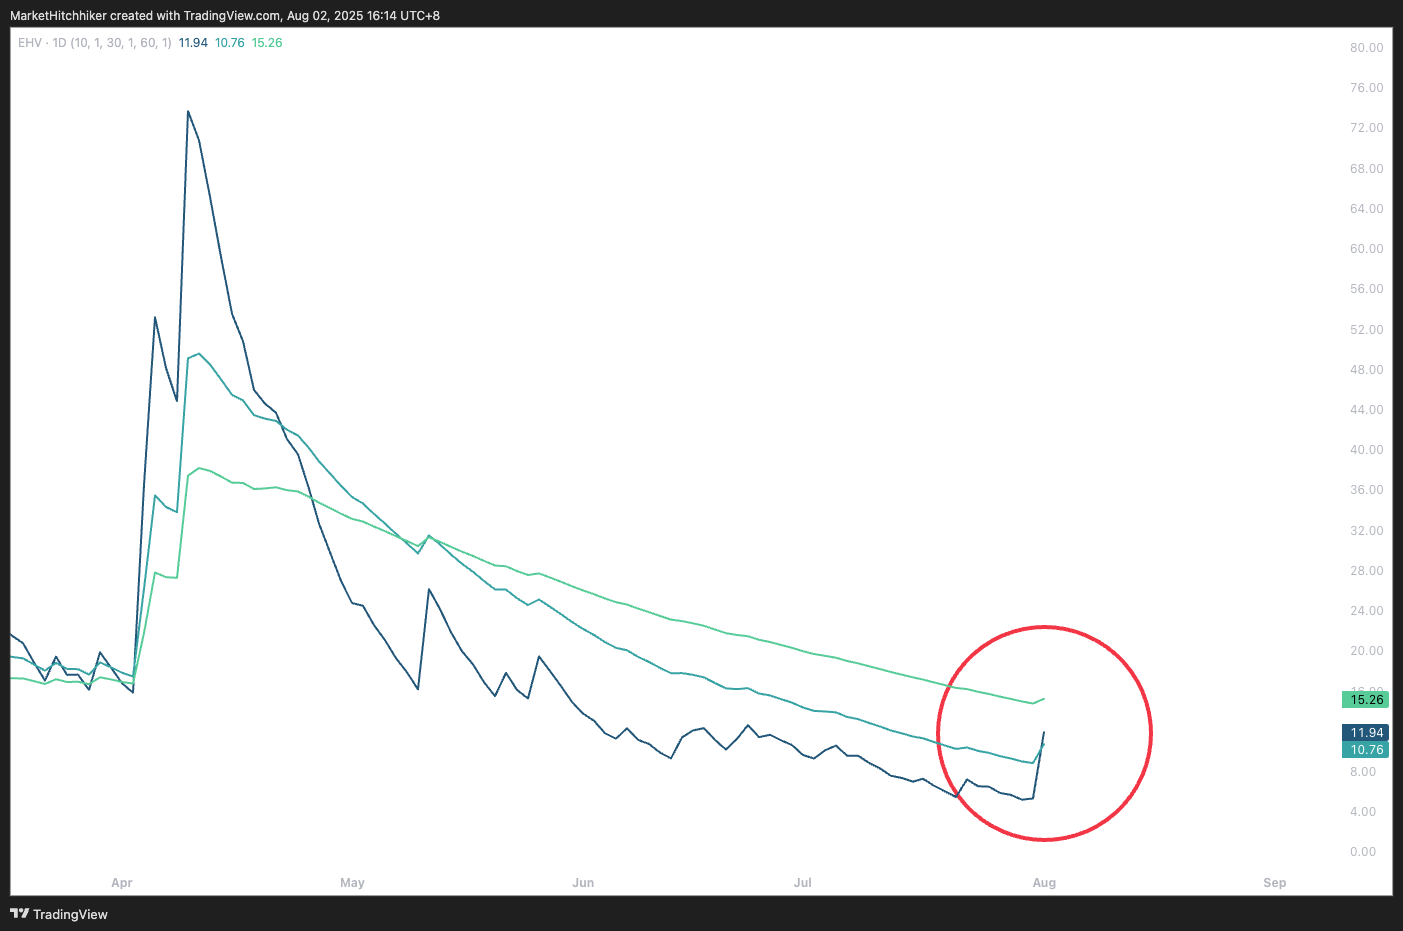
This makes sense, as realized volatility has plunged since Liberation Day, reaching extremely low levels. The chart below shows exponential realized volatility on SPX (10-day, 30-day, 60-day lookbacks). Most Vol Control funds track the max of 30-day and 60-day realized volatility. An uptick is emerging—another couple of days of <-1% returns could trigger the beginning of a deleveraging process.
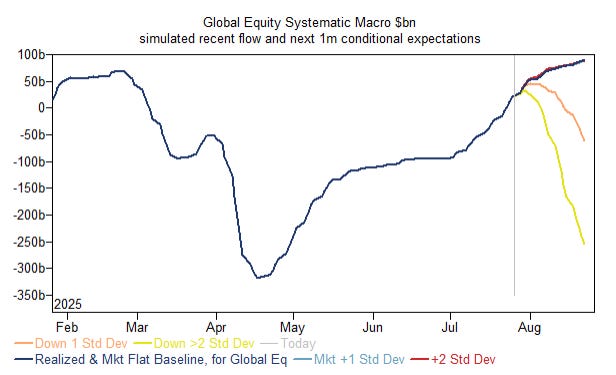
A 2-standard-deviation move could spark a massive wave of selling orders at the close:
This is shaping up to be a perfect storm: short gamma in the market should push market makers to sell, passing the baton to systematic strategies. I’m not predicting a big market crash or a bear market, but there’s a decent chance we revisit the 5800 level, resulting in a 9% drawdown. This is a typical median drawdown, characteristic of a “summer drawdown” that’s part of any bull market.
4. Sentiment
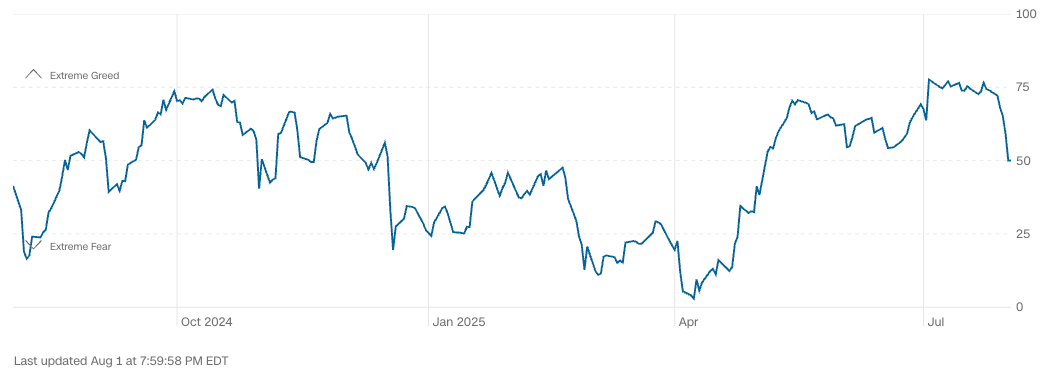
Sentiment is impossible to quantify precisely and is best gauged by closely monitoring social networks like X, as well as headlines and videos posted on YouTube. It’s more art than science! However, we can attempt to measure it with composite indices. CNN’s Fear and Greed Index, while not perfect, provides a broad picture. Sentiment was highly elevated after hitting rock bottom in April. This correction feels completely normal—when sentiment becomes extreme, a pause is often needed.
Warren Pies from 3Fourteen Research echoed this sentiment recently:
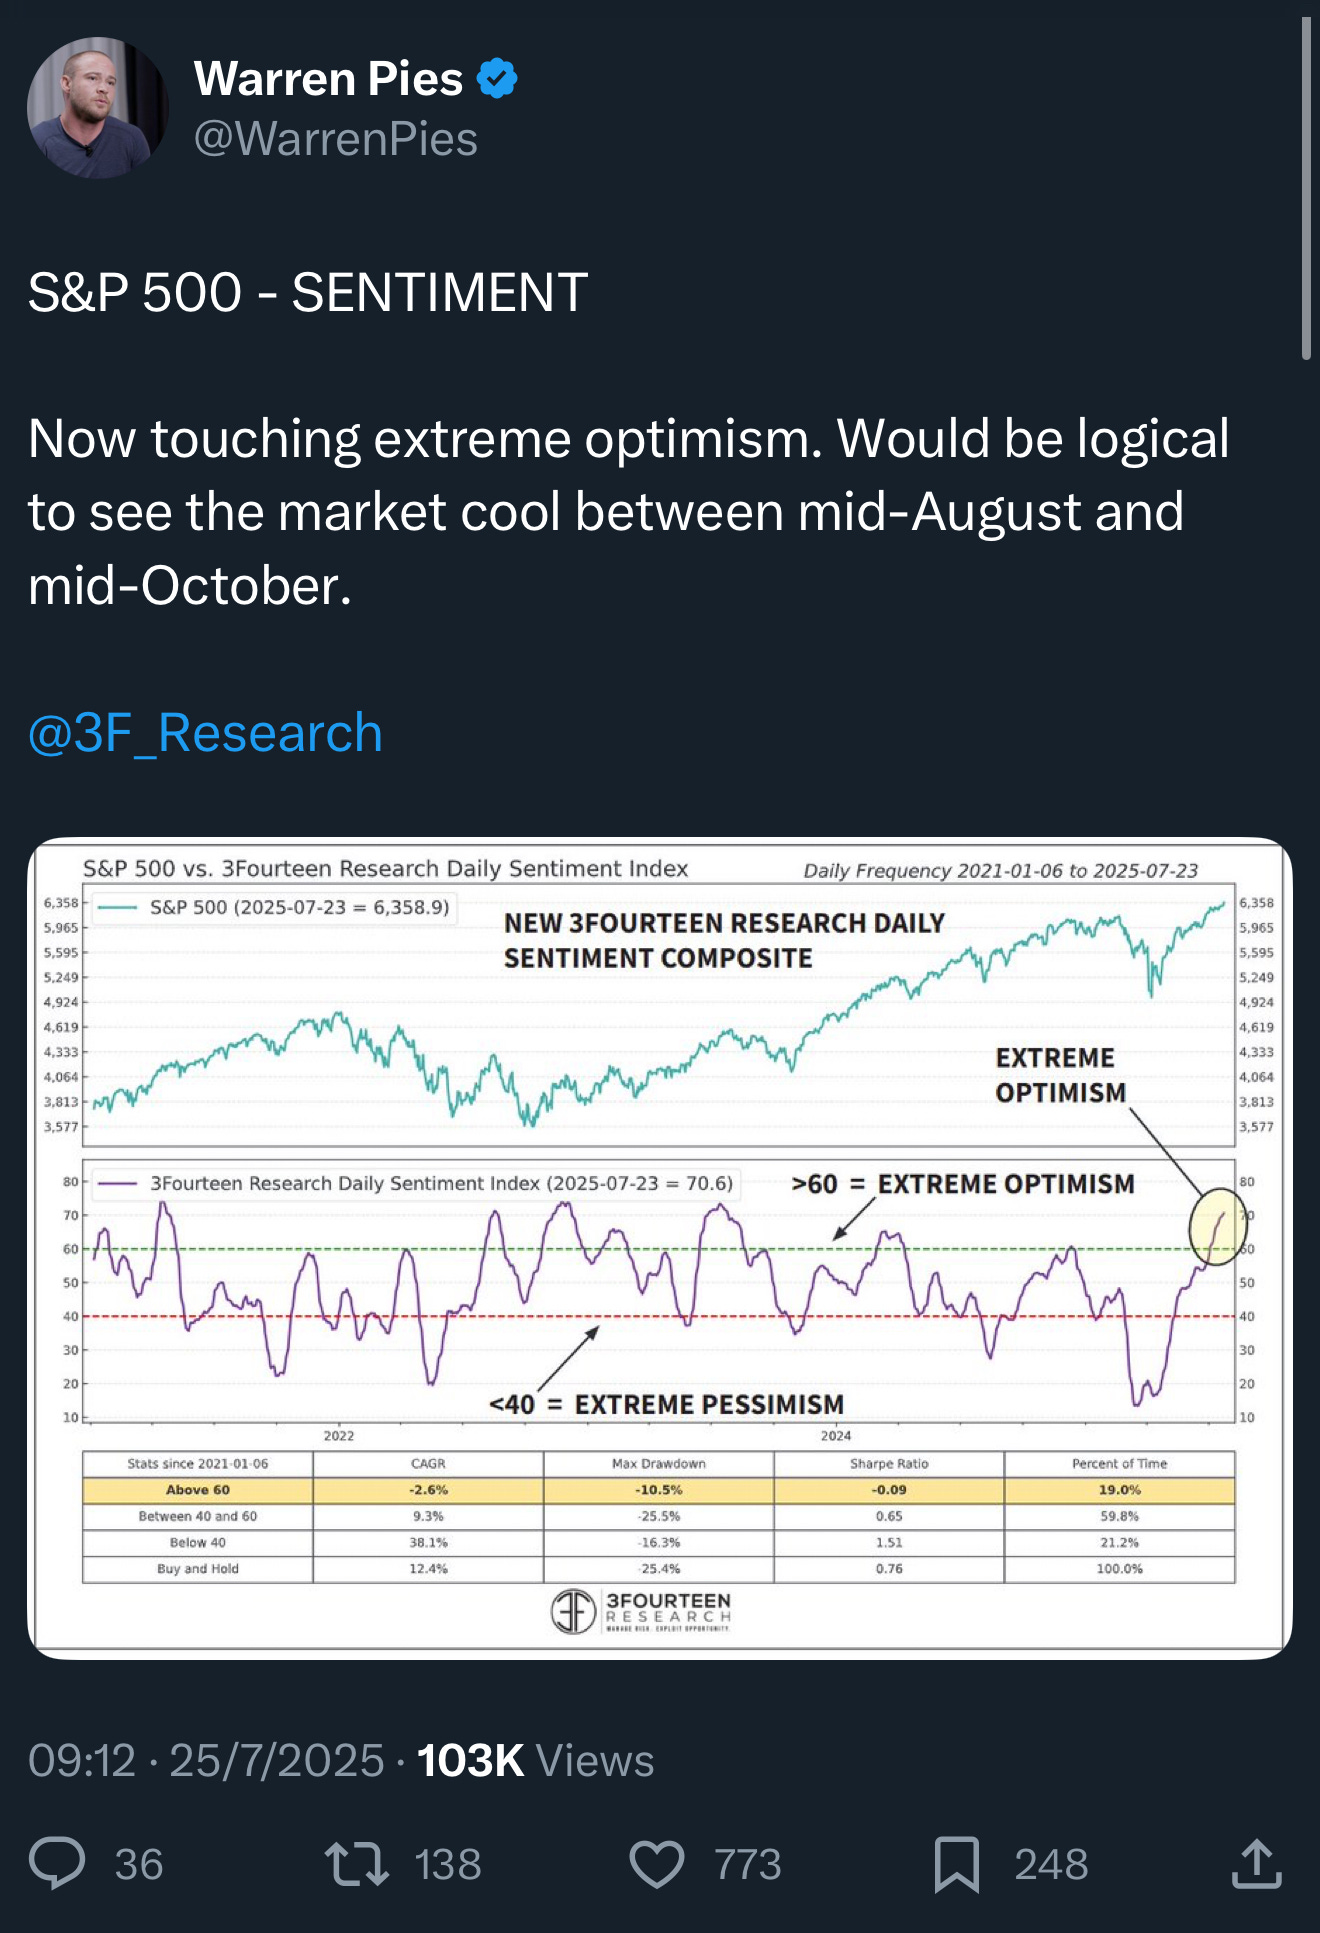
I’ve noticed overly confident bulls on X. When random accounts publicly mock bears, it signals a sentiment top.

Someone replying to George, who’s been ultra-bearish recently:

Sentiment often follows price, so I expect it to reset quickly. I’m now watching for cocky bears or crash calls. This game is mass psychology—maybe I should’ve studied psychology instead of financial engineering!
In a crowd every sentiment and act is contagious, and contagious to such a degree that an individual readily sacrifices his personal interest to the collective interest.
Gustave Le Bon, The Crowd: A Study of the Popular Mind (1895)
Conclusion
The most important points to remember:
Fundamentals: The market is repricing the probability of a recession, previously at around 10%. It has a long way to go before overshooting to 50% or higher. In Week #20, I outlined the case for lower growth, and it’s encouraging to see this narrative slowly emerging.
SPX Implied Parameters: We’ve entered a self-exciting process on the risk-off side—VIX, VVIX, and COR1M are showing positive impulses. We don’t fade this until signs of exhaustion appear.
Positioning and Flow: Our first target for this correction is 5870, where the JPM long put strike sits. Market makers are likely to sell on red days, with CTAs and Vol Control funds amplifying the selling. Let’s stay very open-minded; revisiting Liberation Day’s lows is within the realm of possible outcomes. This market is structurally heavily short gamma. However, our base case is a median drawdown of roughly 10%.
Sentiment: Sentiment was completely stretched. Markets thrive on climbing a wall of worry, and hopium isn’t a strategy. This reset is a natural part of a bull market—healthy and normal. It could turn more sinister if macro conditions accelerate toward recession or stagflation. For now, we’re betting on a repricing of recession risk, not an actual recession.
As traders, we place risk-adjusted bets based on an expected distribution of outcomes. From my perspective, I see a strong likelihood (>70%) that this market dip will develop into a 10% correction. Of course, there’s still a possibility this dip is inconsequential, and we could rally to all-time highs as early as Monday—that’s just part of the game. Ultimately, trading is about making calculated, risk-adjusted bets. This trade may not pan out, but I’m confident in my process, which I believe will yield consistent profits over the long term.
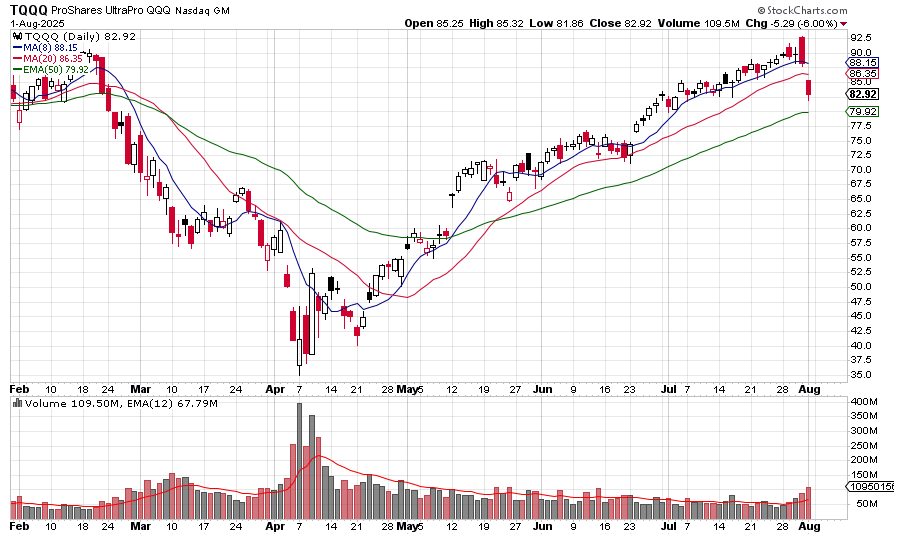
One final chart: TQQQ, the leveraged Nasdaq ETF, is a retail favorite for buying the dip. Retail investors, empowered by platforms like Robinhood and Interactive Brokers, are a structural market force after 15 years of “buy the dip” conditioning. A significant TQQQ volume spike could signal retail buying, potentially forming a market bottom, as seen on Liberation Day. Watch for this spike.
Good luck out there.
If you like this post, please share it: