
Is the market looking past the forecasted slowdown in H2-2025 and 2026? [Week #20]
Are they really running it hot? When market and economy are diverging, one has to give

Macro dashboard update
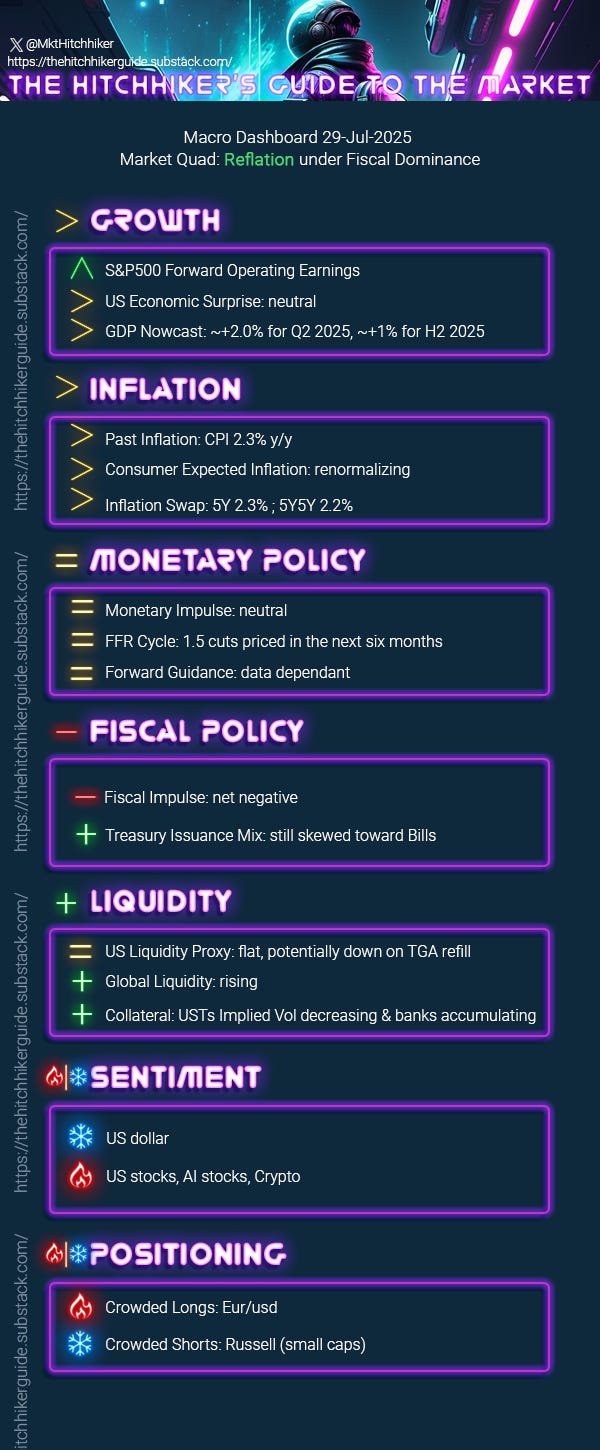
Growth
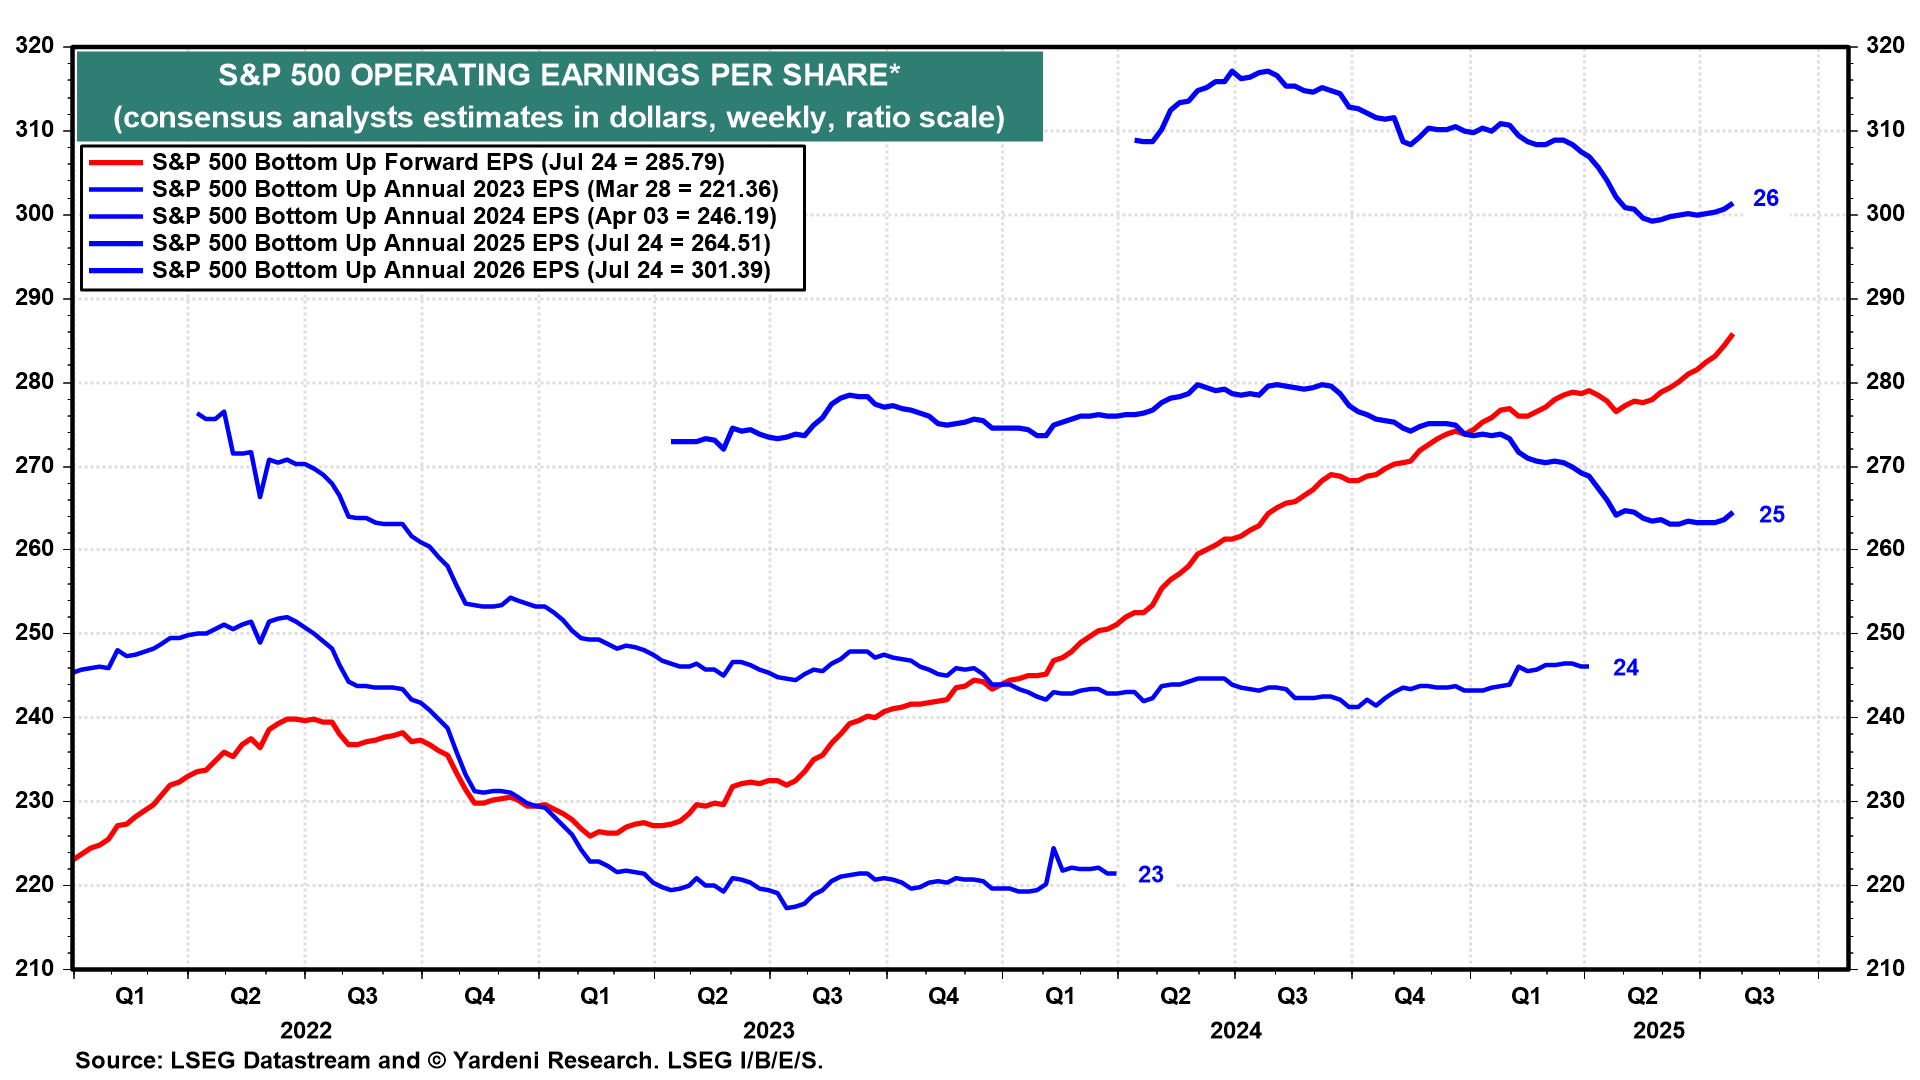
S&P 500 Forward Operating Earnings: Okay, this is getting crazy now—the 12-month forward EPS is roaring and back to its pre-Liberation Day trend. It doesn't get more bullish than that.

A month ago, in Week#18, I called for a melt-up in US stocks based on fundamentals, flow and positioning. My main argument on the fundamental side was the incoming earning season:
“ Q2 2025 is showing signs of recovery, setting the stage for a robust earnings season this summer. This positive momentum is expected to drive the S&P 500 to new highs. ”
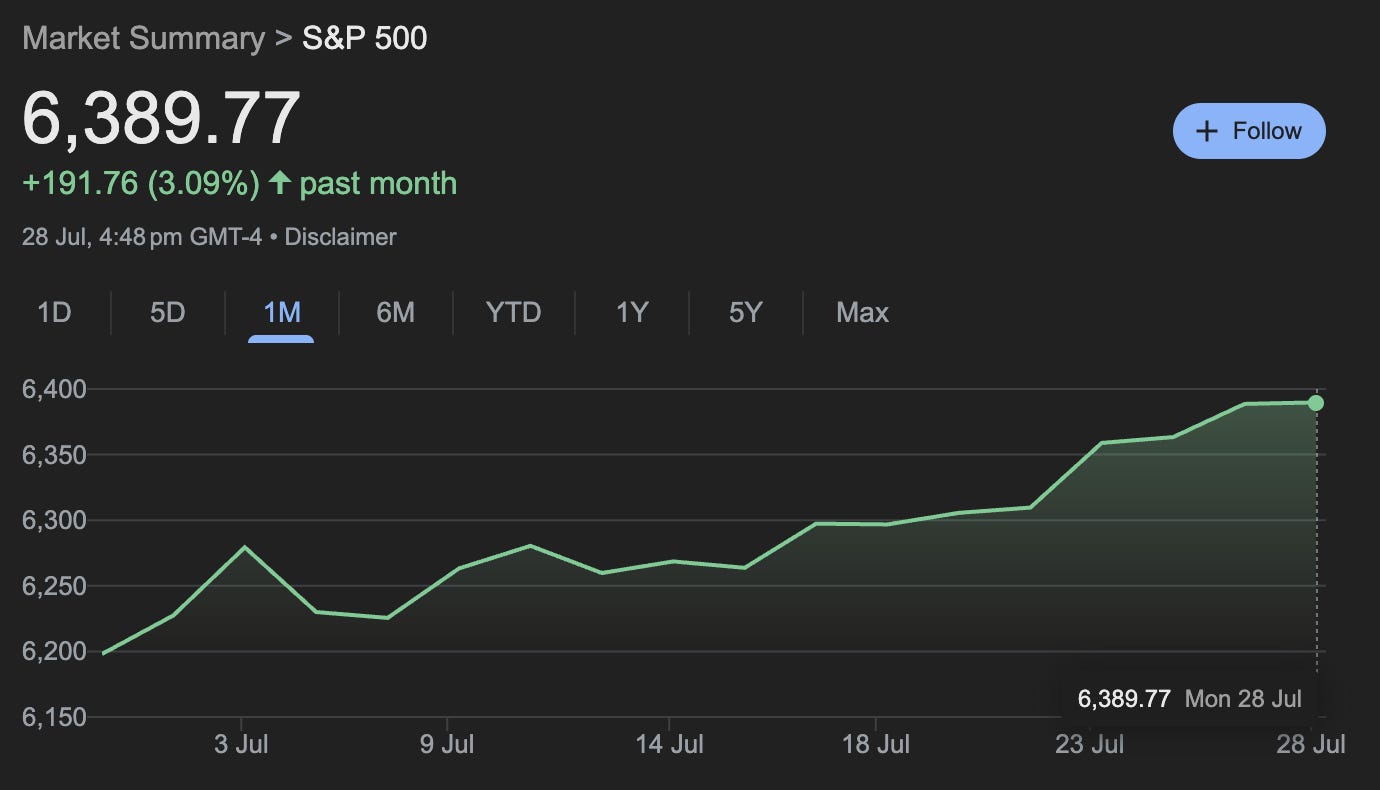
Just like clockwork, Q2-2025 EPS has been recovering, driving the S&P 500 to 6,400.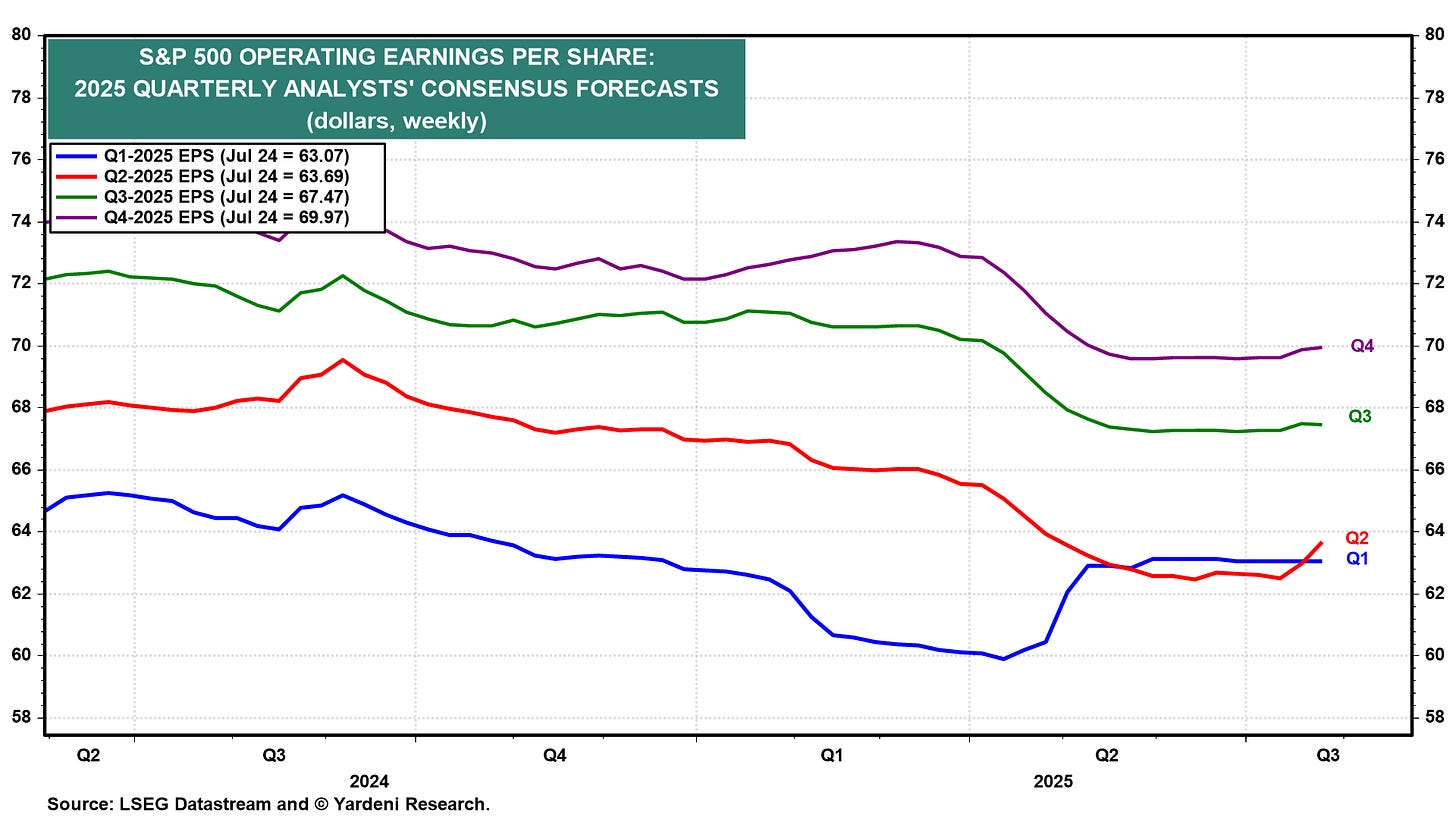
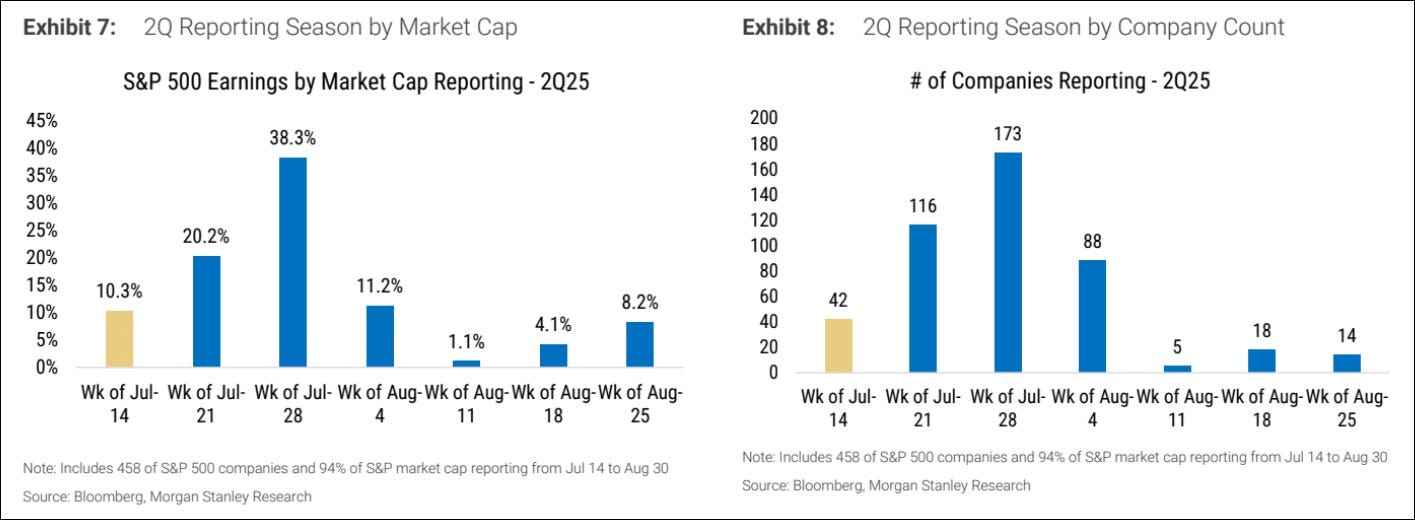
We are now in the most important week for earnings. Most companies have been beating expectations so far, but there are still some very important ones left: Meta and Microsoft tomorrow, Apple and Amazon on Thursday. Place your bets…


The most important sector is, of course, Technology. As a reminder, it makes up 33% of the EPS in the S&P 500. As you can see below, only 23% of tech companies have reported so far, and almost all of them have beaten on sales (88%) and EPS (82%).
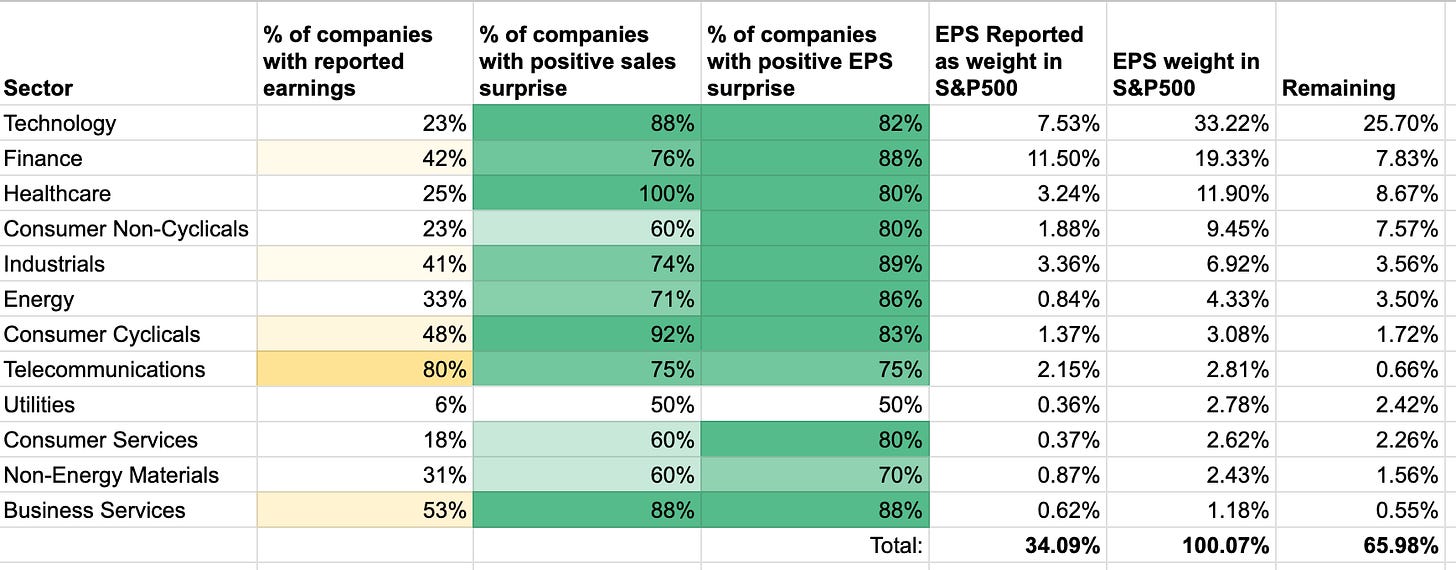
Sales and EPS surprises after earnings 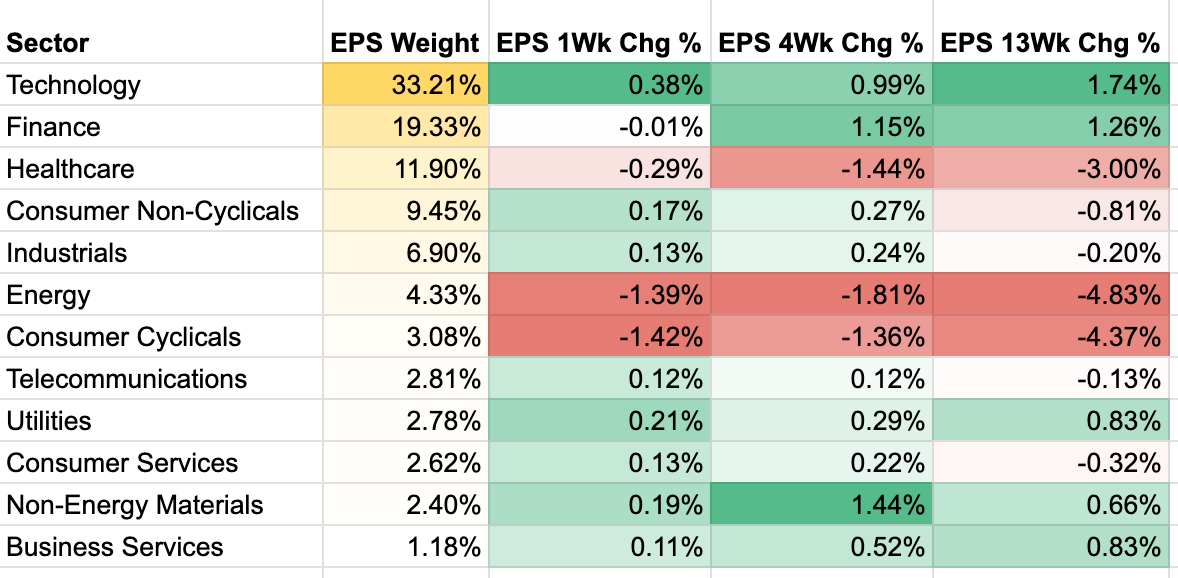
EPS FY1 revision for the entire market NVIDIA, Microsoft, Apple, Amazon, and Meta account for nearly 20% of the EPS in the S&P 500. This leaves room for additional positive earnings to further boost the Nasdaq. However, it also means their potential disappointment could derail this bull market. I think that's unlikely—the bar is set too low for them. Additionally, a weaker US dollar significantly benefits these companies, as roughly half of their revenues come from overseas.
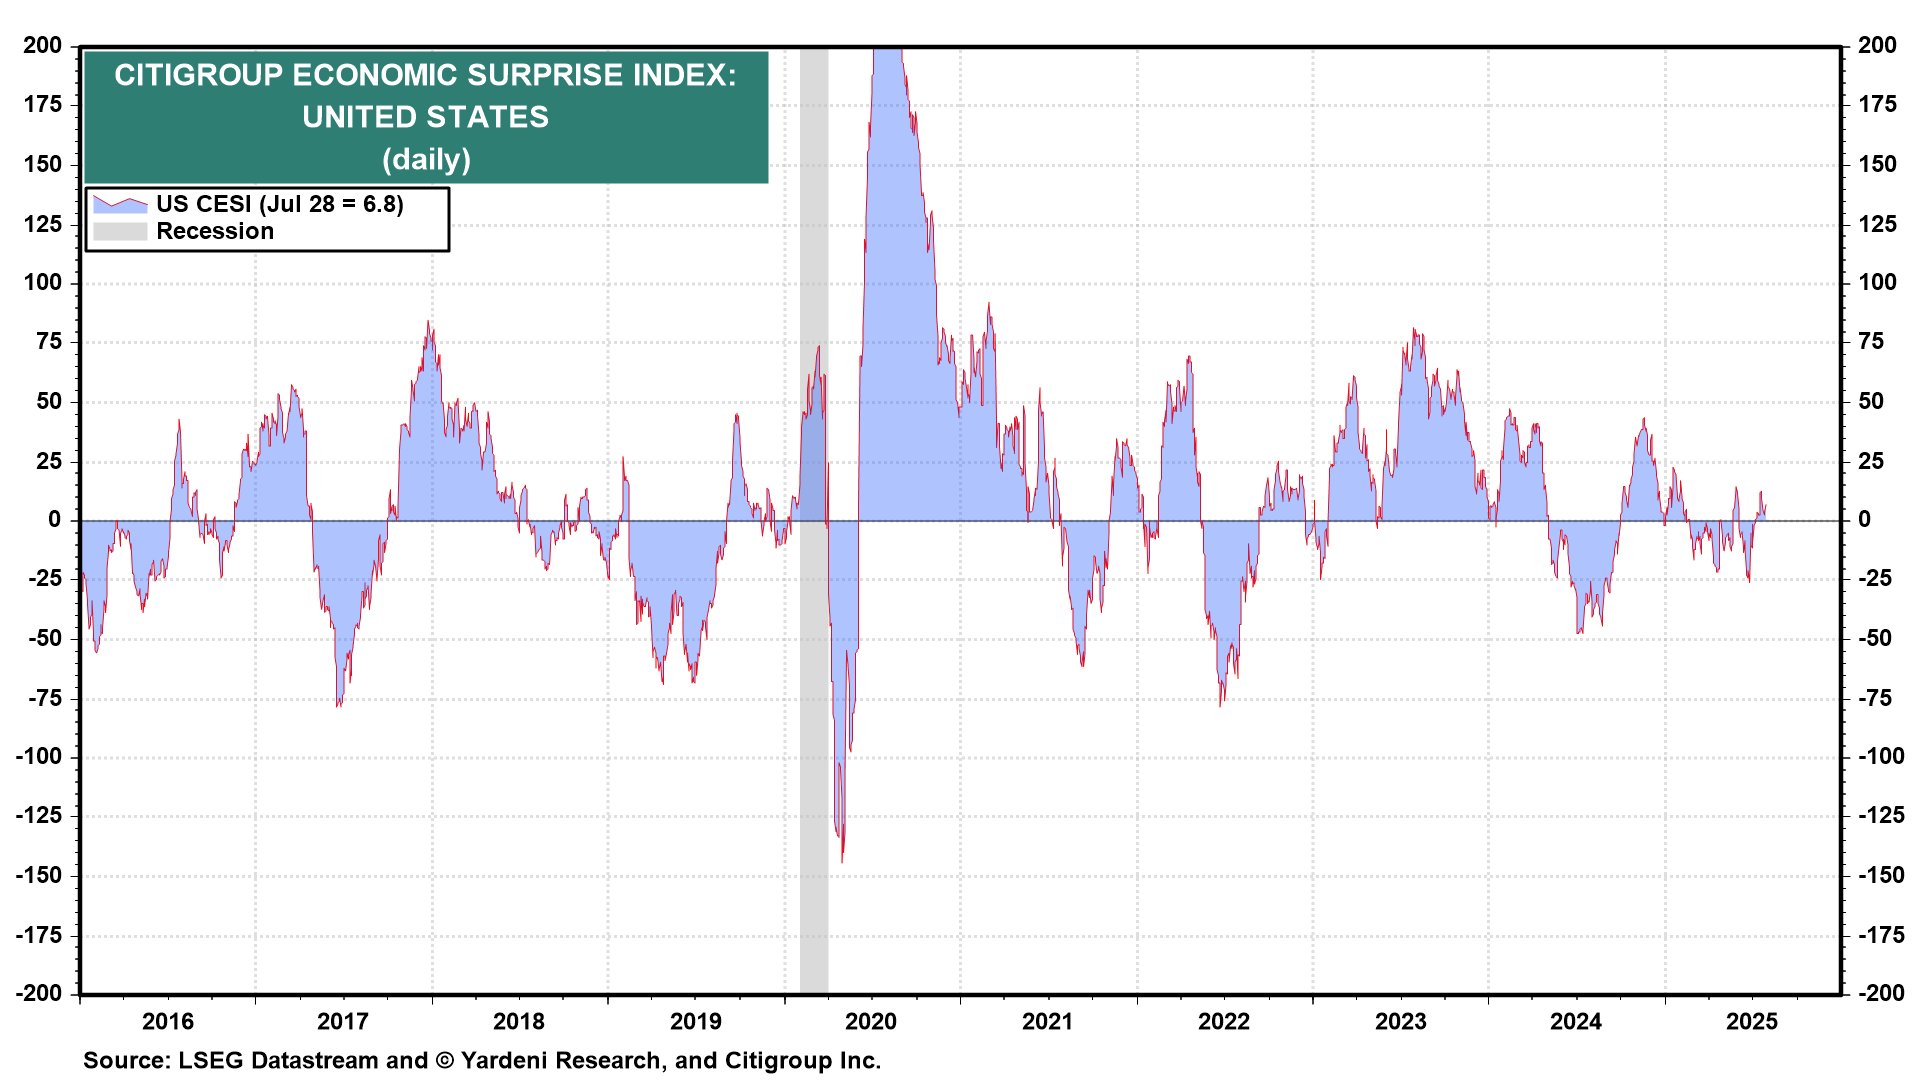
US Economic Surprise: Despite macro traders being extremely bearish (more later), the US Economic Surprise Index is neutral, slightly positive. Tariffs and uncertainty haven’t impacted yet. Could tariffs soon hit US consumers? Possibly, but being early is as good as being wrong.

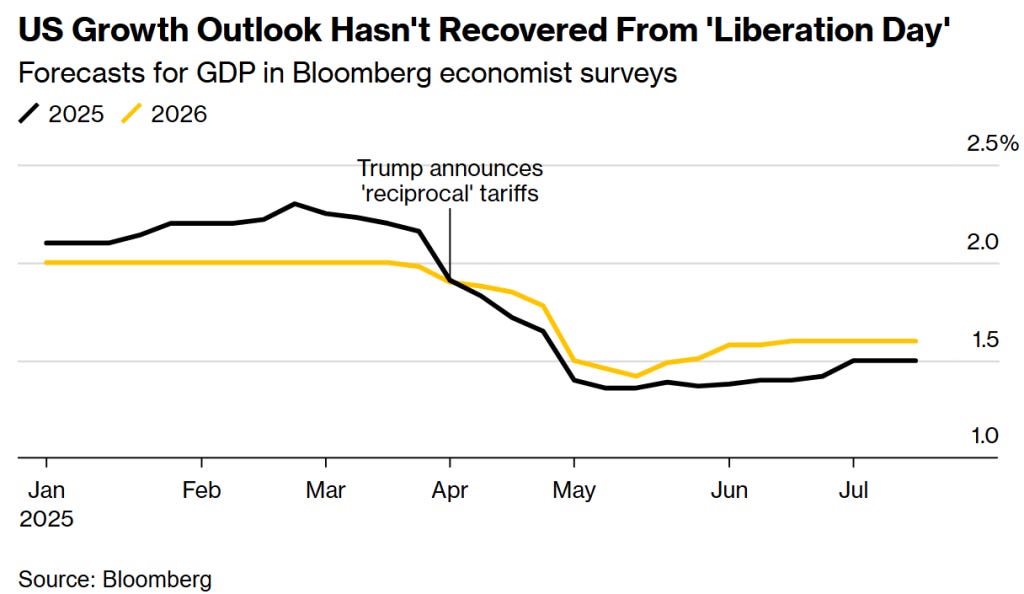
GDP Nowcast: The Atlanta Fed’s GDPNow estimate is softening, converging toward +2%, aligning with the Blue Chip consensus.
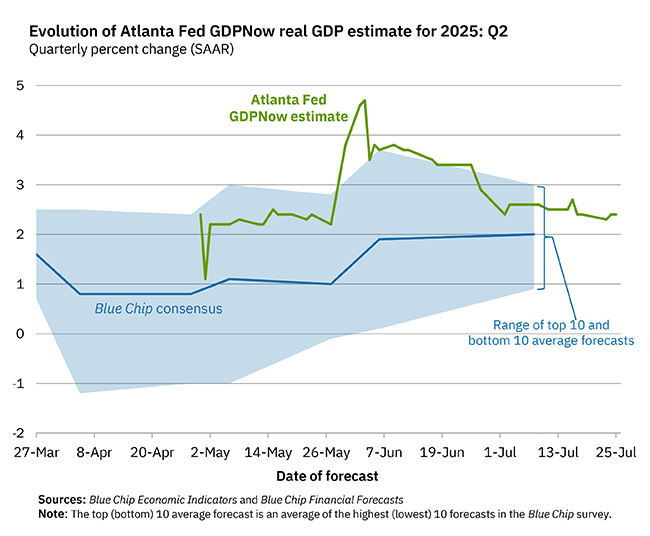
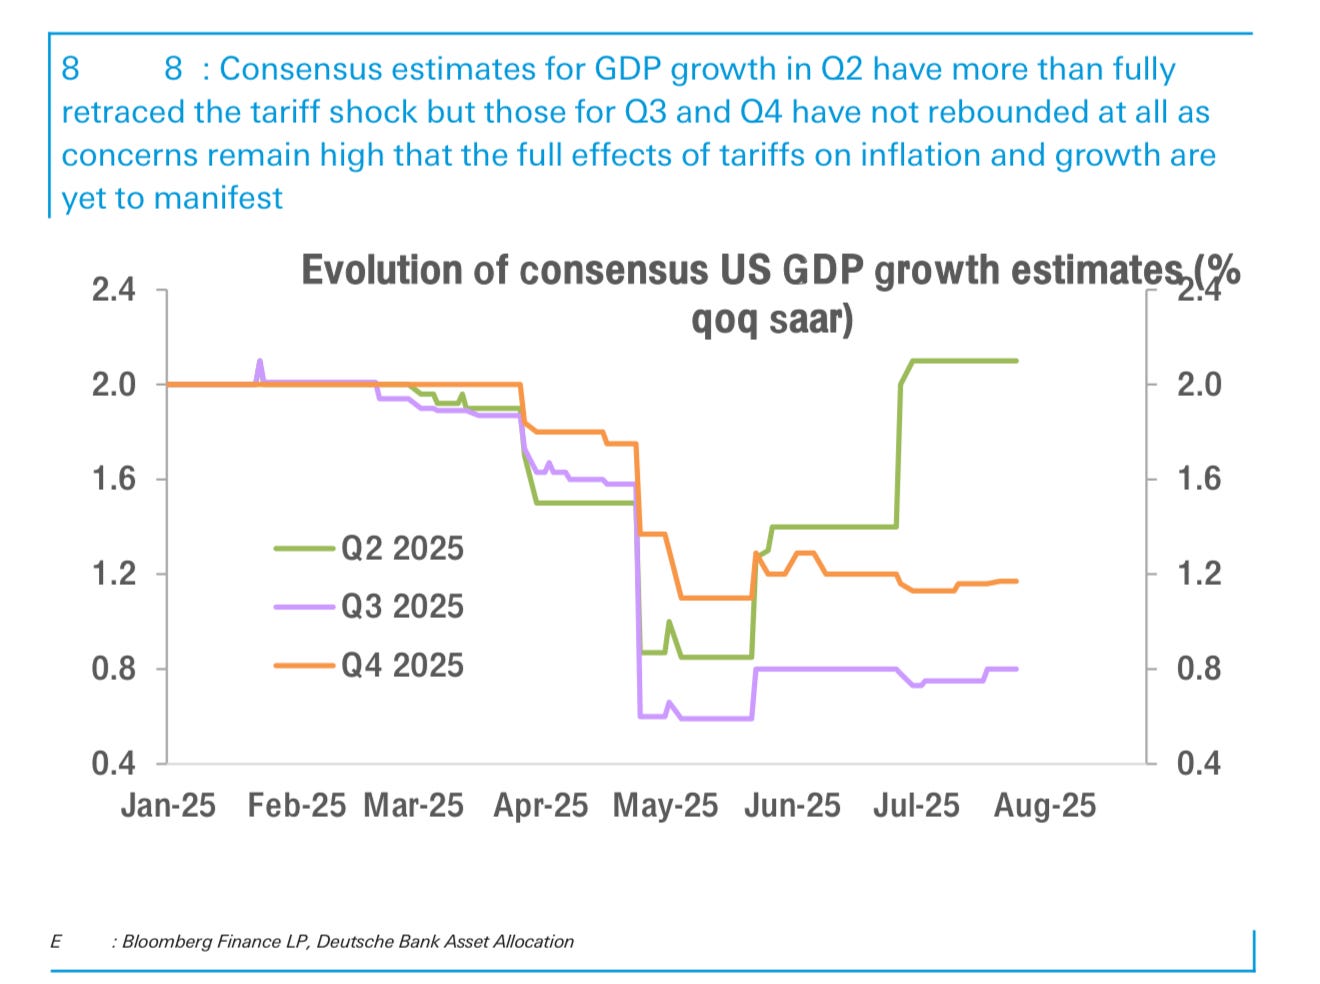
Below is a more detailed view from the so called Blue Chip consensus. One can also see the expectations for the second half of the year: slow growth with 0.8% in Q3-2025 and 1.2% in Q4-2025:

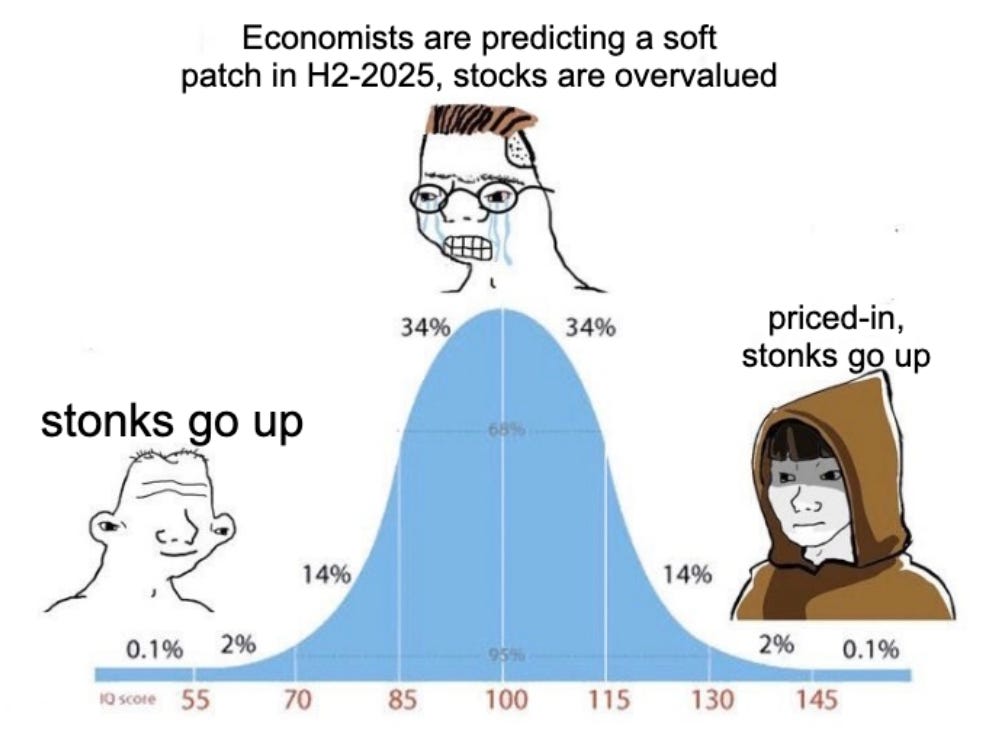
There are two interpretations, depending on your bias:
OMG Growth is slowing in H2-2025, per economists, and the stock market, at 22x forward P/E, isn’t pricing this. The market is a short here.
The H2-2025 soft patch is already priced in by markets. The stock market looks beyond 2025, and the soft patch provides cover for the Fed to cut rates by 100 basis points. Stay long and strong.
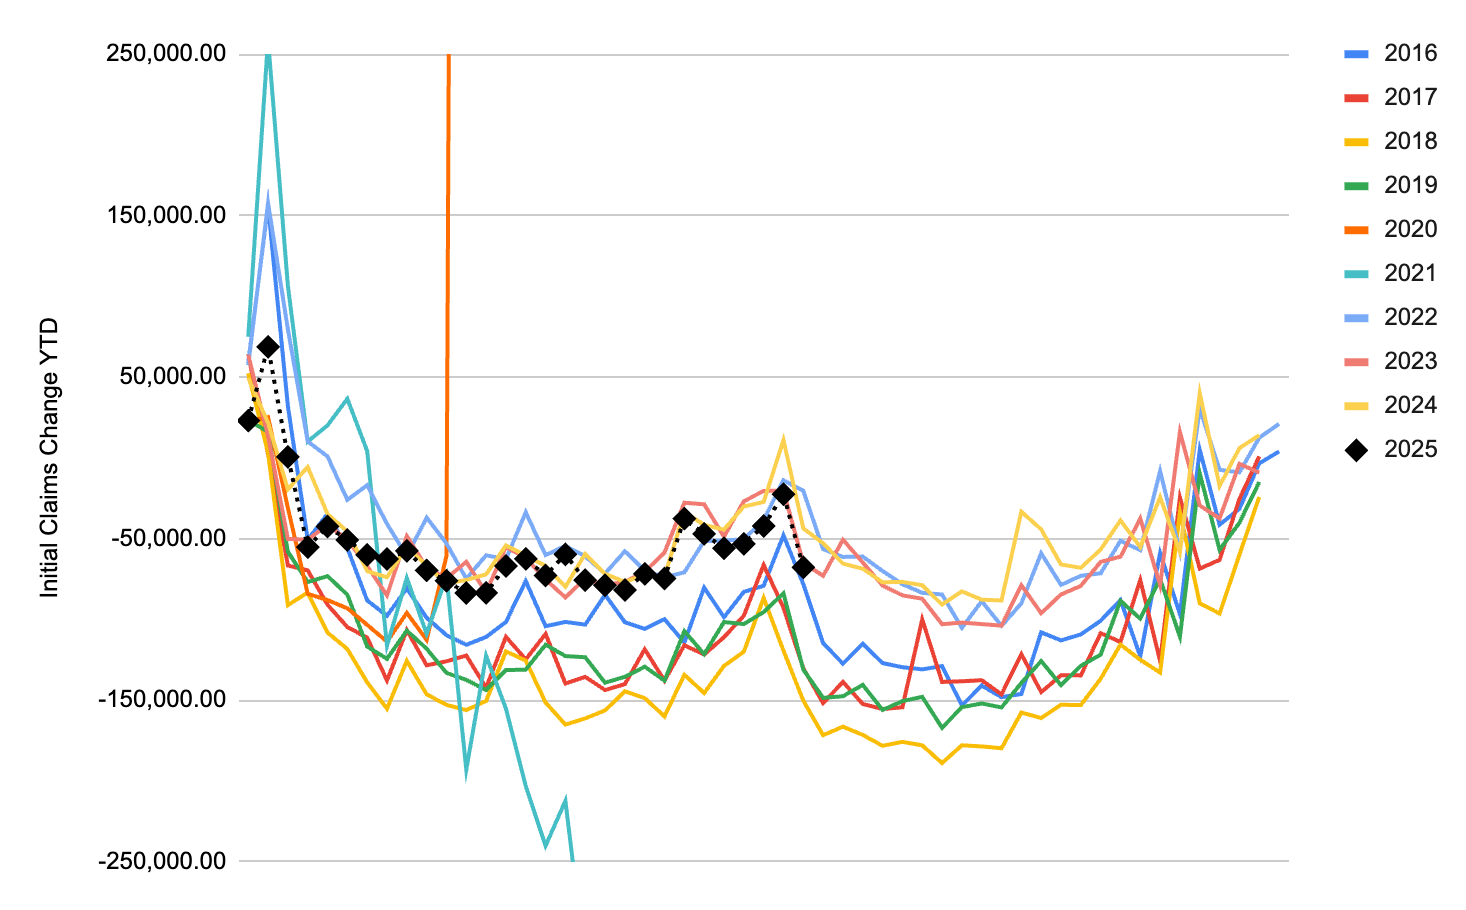
Initial Claims: Seasonality is kicking in, right on time! The 2025 path for initial claims is tracking last year’s median path—a solid real-time signal of a healthy job market.
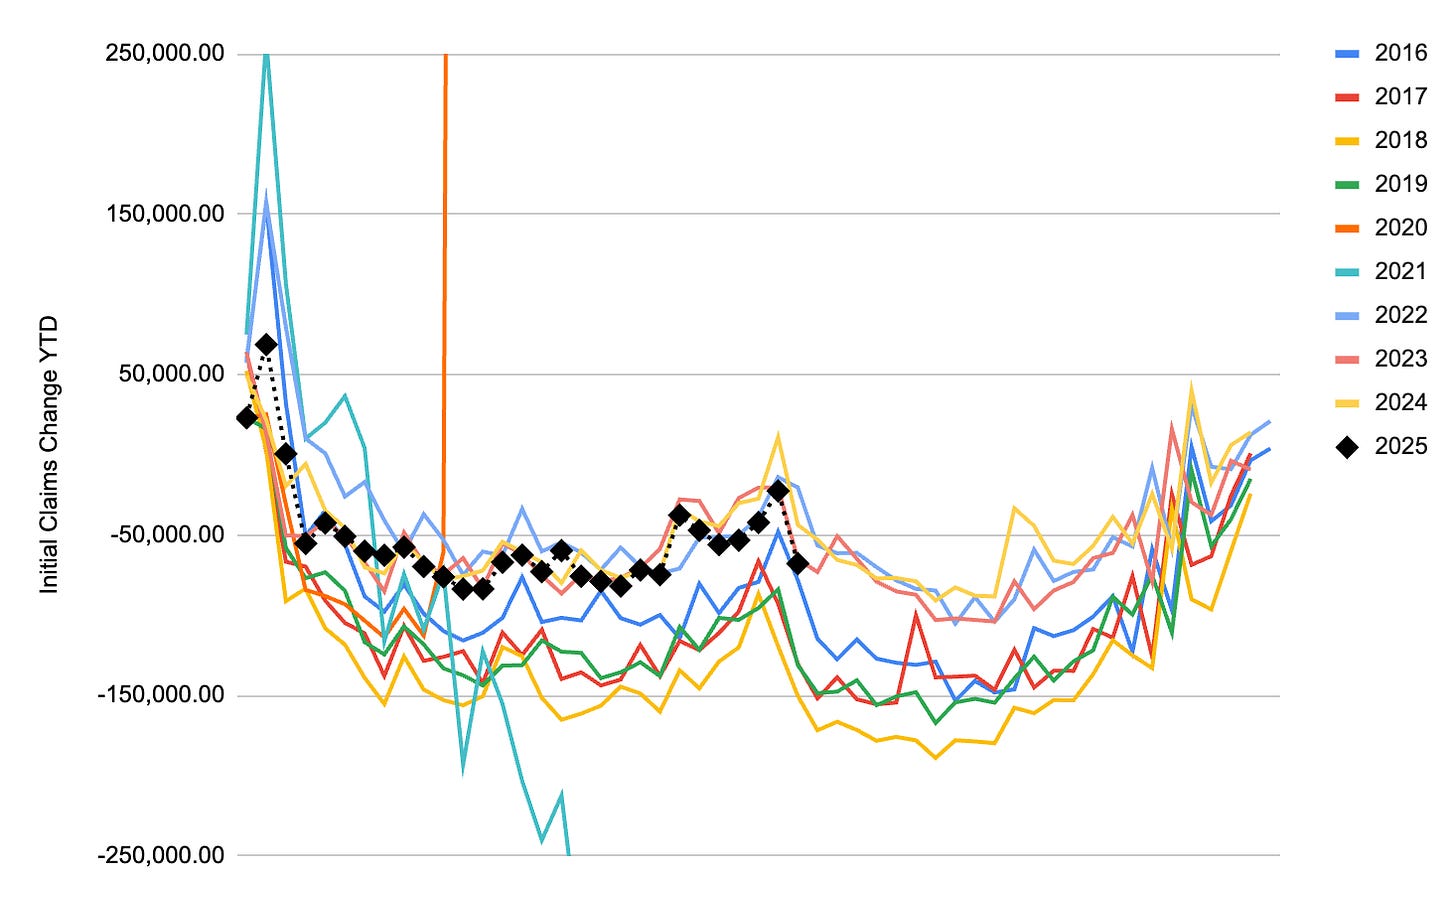
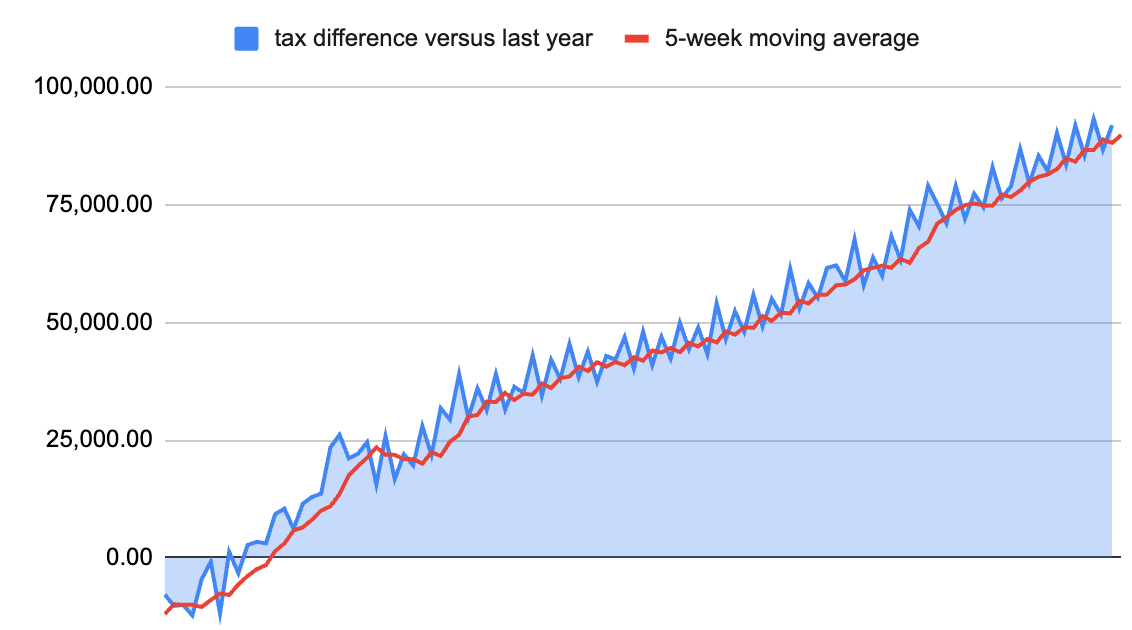
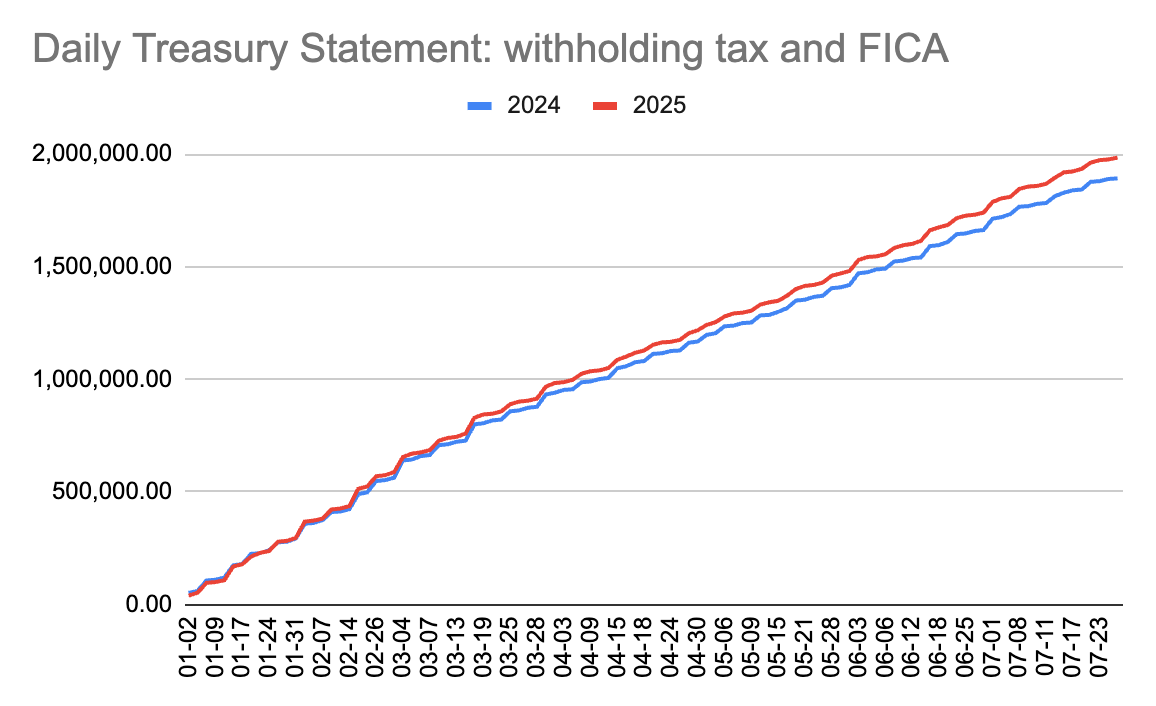
Daily Treasury Statement: Withholding tax and FICA data show we’re outpacing last year. No doubt about it—the job market’s humming along.


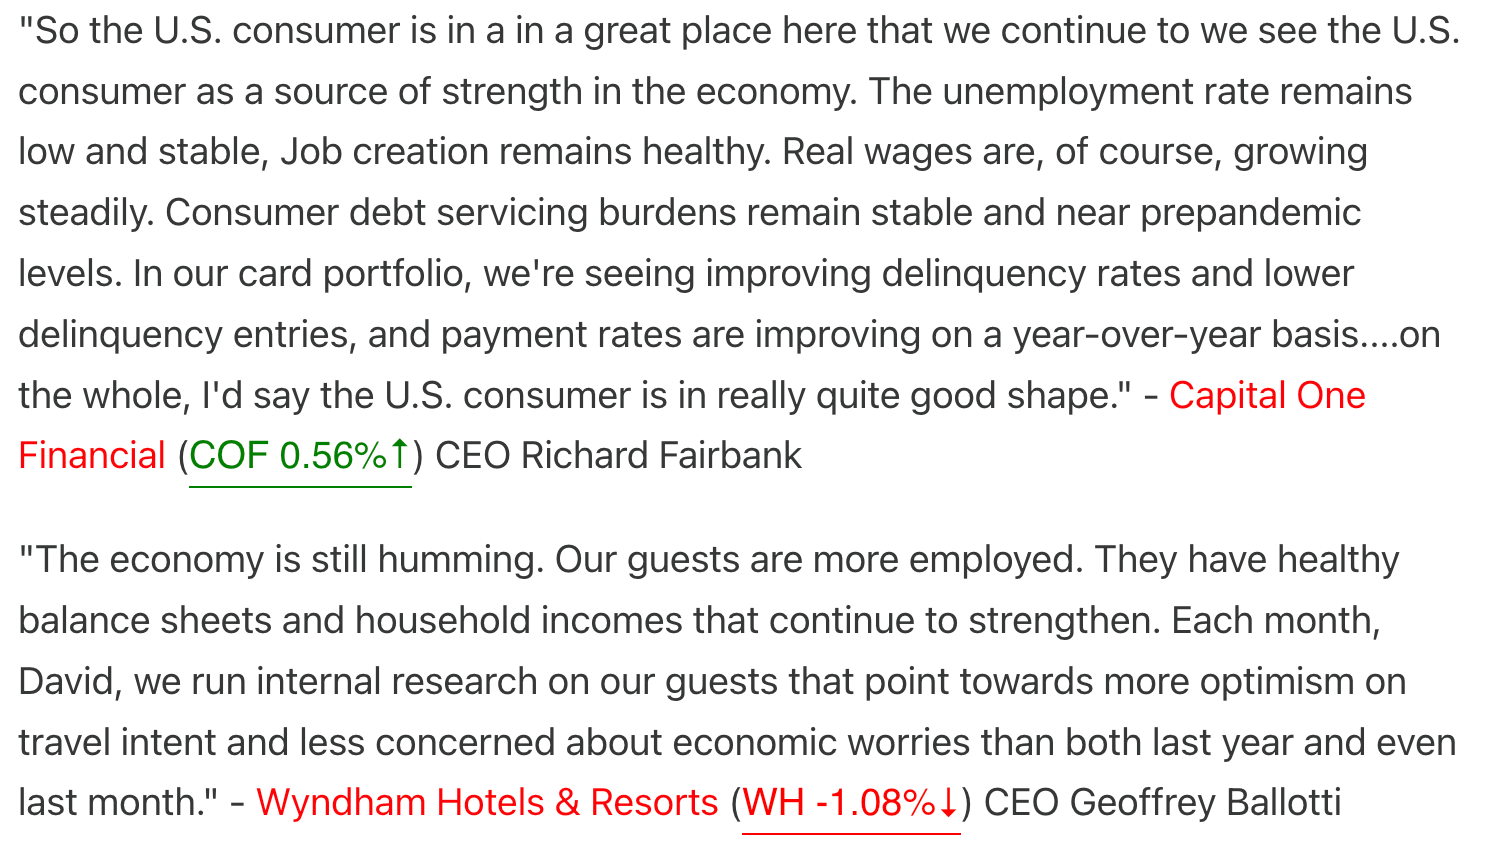
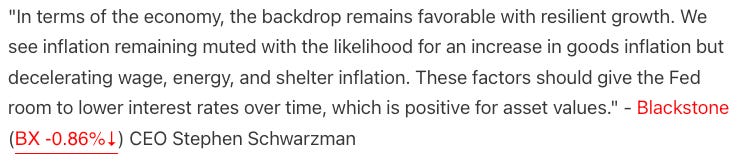
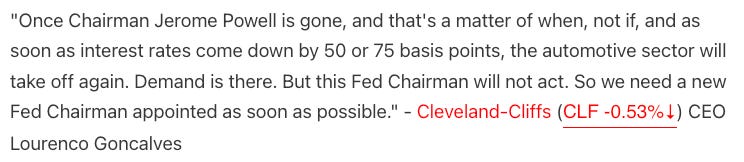
→ No change to the Growth category. The negative impact from tariffs is still coming, and a soft patch in H2-2025 is well telegraphed. It’s a wall of worry to climb. Earnings and forward earnings are on fire, and initial claims and DTS data point to a resilient job market. That means a strong US consumer, the backbone of the economy and stock market.
Evidence from below statements from COF 0.00%↑ CEO and WH 0.00%↑ CEO during their last earning call:
Side note: I highly recommend The Transcript’s Substack. It’s been invaluable for tracking earnings calls, summarizing key comments, and blending micro and macro insights. Combining their micro trends with my macro analysis creates tremendous alpha. I’ll do this more.
Inflation
CPI: June’s inflation data, released two weeks ago, was benign, aligning closely with estimates.
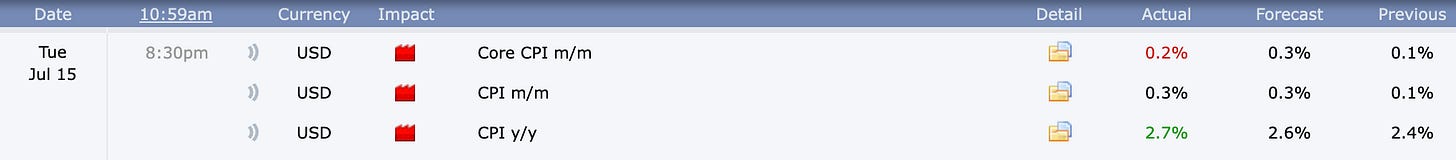
Looking at the components, we see three things: (1) Housing is still in a deflationary trend, (2) Core goods are re-inflating, while (3) services are stuck around 3%. Overall, I continue to think inflation’s a non-issue. I’ll hammer it one last time: the three broad vectors of inflation—oil, housing, growth wages—are all pointing toward benign inflation.


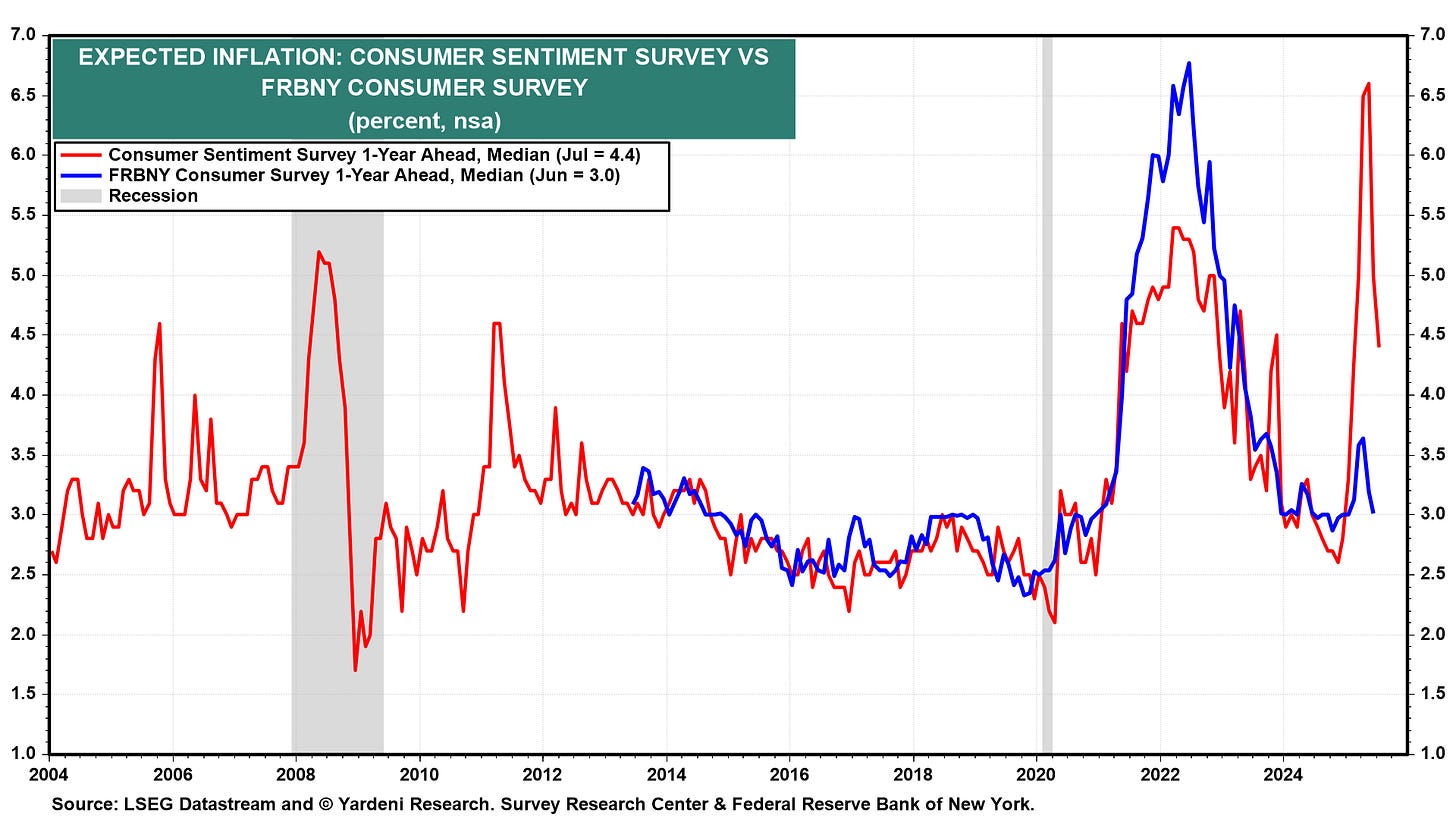
Inflation Expectations: No new survey results, but so far, so good—expectations are settling down.

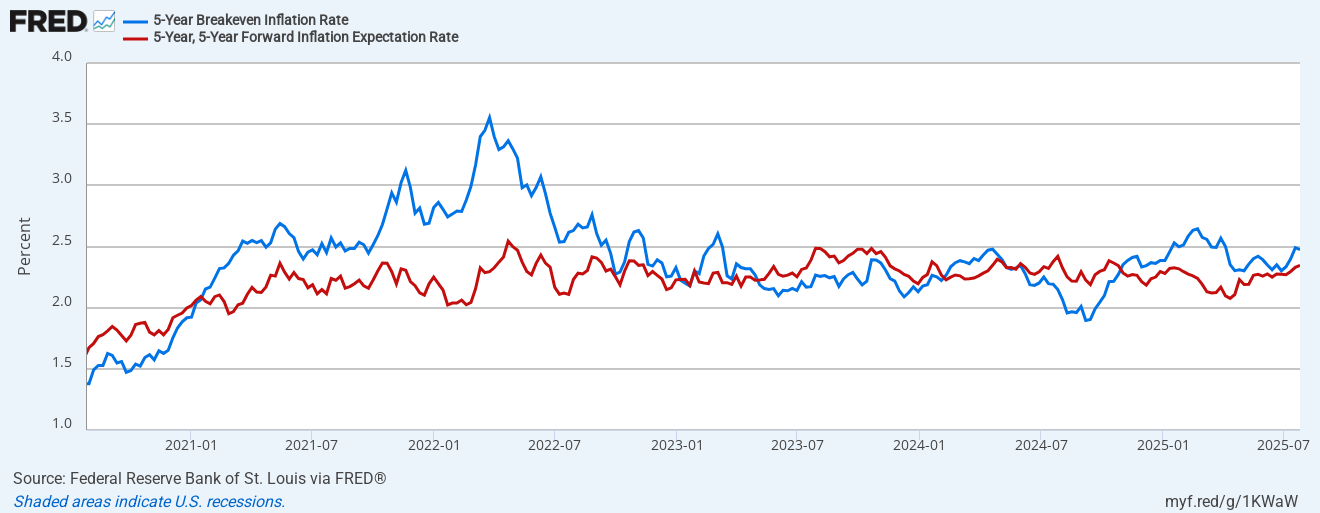
Inflation Swaps: Boring chart, but the economy loves boring inflation. Trump’s threats to fire Powell aren’t shaking the inflation swap market.

→ No update for the inflation category.
Monetary Policy
Monetary Impulse: Remains neutral. Monetary policy is not currently driving the US economy or stock market.
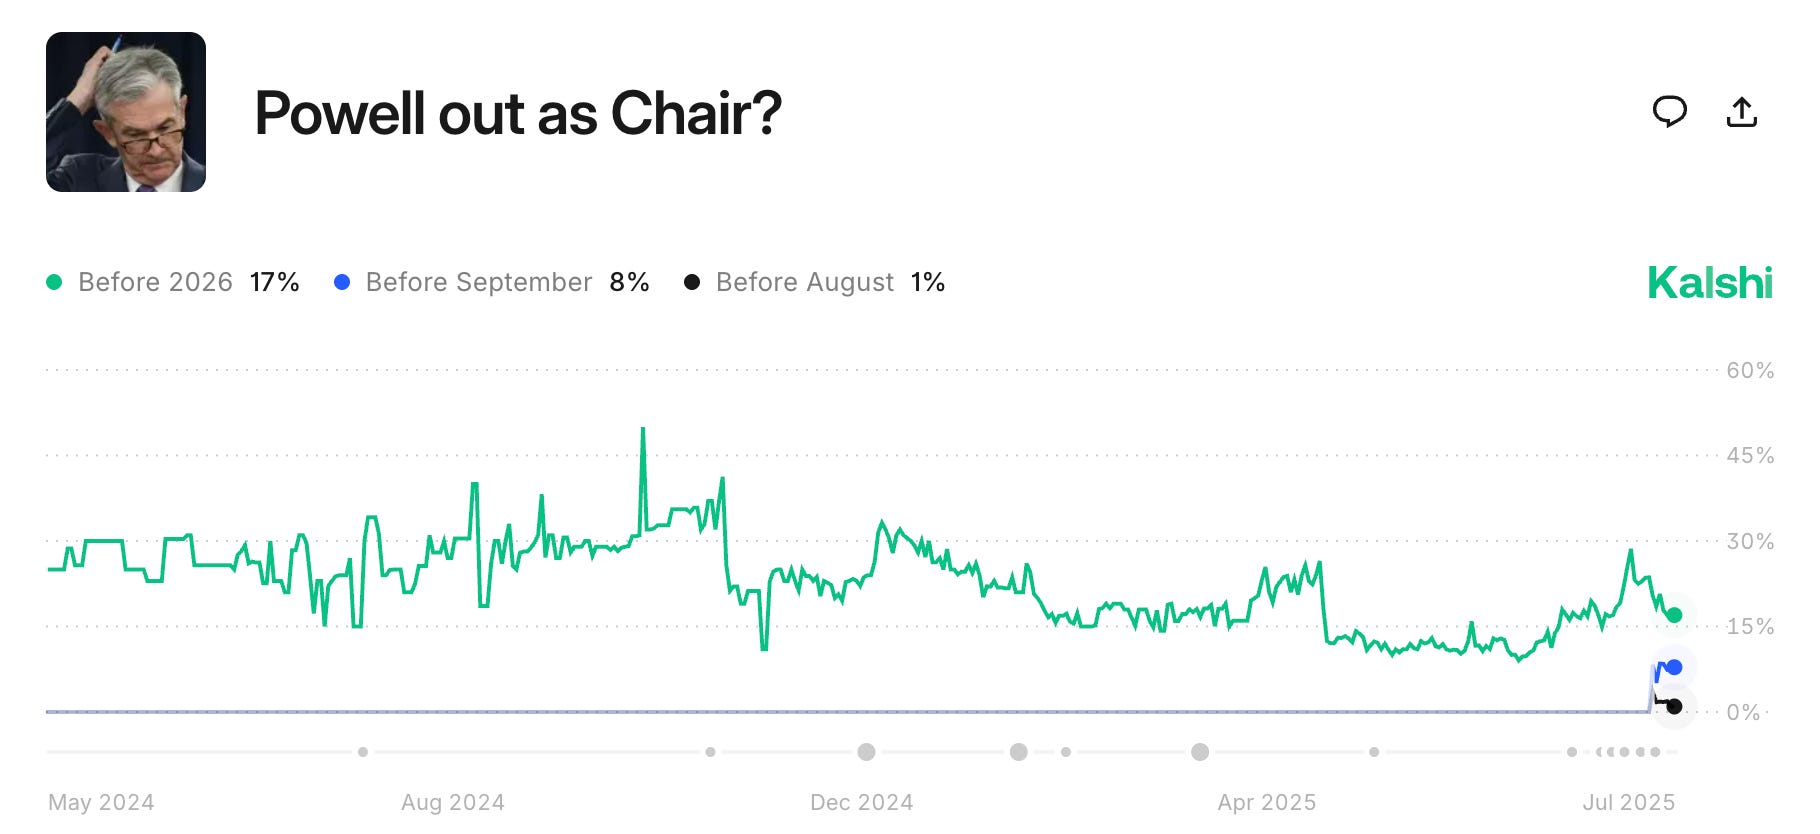
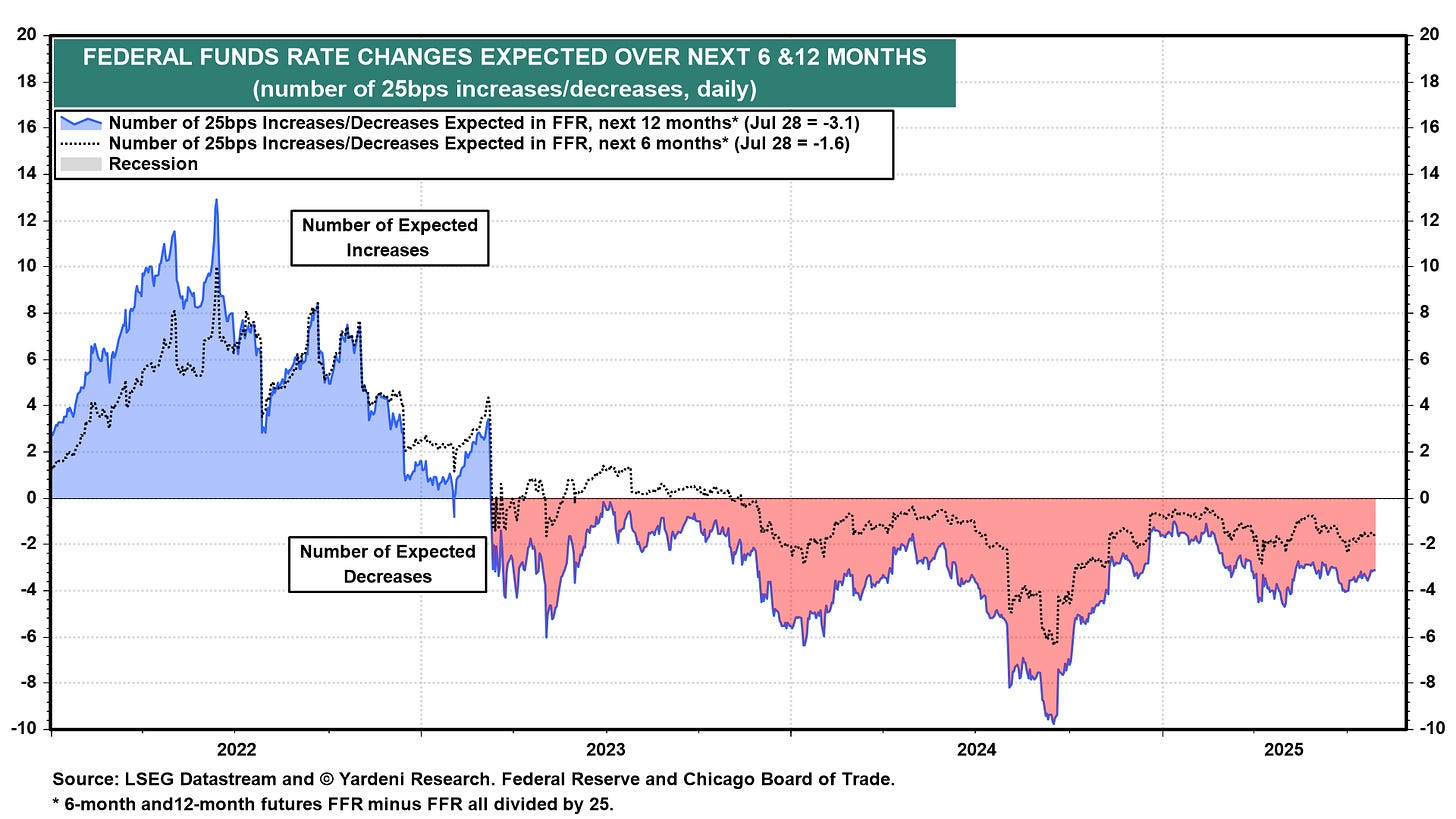
Fed Fund Rate Cycle: The market is pricing in 3.1 cuts over the next 12 months and 1.6 cuts in the next six months. Cuts are being slowly priced out despite all the pressure on chairman Powell to cut.

Forward Guidance: The next FOMC meeting is in 24 hours, and we’ll get a clearer picture of the fed funds rate path. I think the market’s pricing in the most likely scenario: about 1.5 rate cuts by year-end. There’s a solid chance Powell leans a bit dovish, given how tame inflation’s been—I’ve been hammering that point! But I’m not expecting more than 1 or 2 cuts. Unemployment’s low, credit spreads are at all-time lows, and the stock market’s hitting record highs. In other words, financial conditions are nowhere near tight. Trump’s been piling pressure on Powell—we even saw a “trial balloon” with rumors of him getting fired. The market didn’t love that: stocks, bonds, and the US dollar all dipped. Messing with the Fed’s independence puts the whole “US exceptionalism” thing at risk, but I doubt Trump’s actually going there. Right?


→ No change to the Monetary Policy category. I’m sticking with one or two cuts by year-end. Financial conditions are loose, so there’s no rush to cut, but market players and company execs are already gearing up for it.
Fiscal Policy
Let’s talk tariffs, OBBB, immigration, and the fiscal impulse.
US Customs has collected $136 billion so far, on pace for $325 billion annualized. Two big questions: Who’s paying the bill? And is it a big deal?
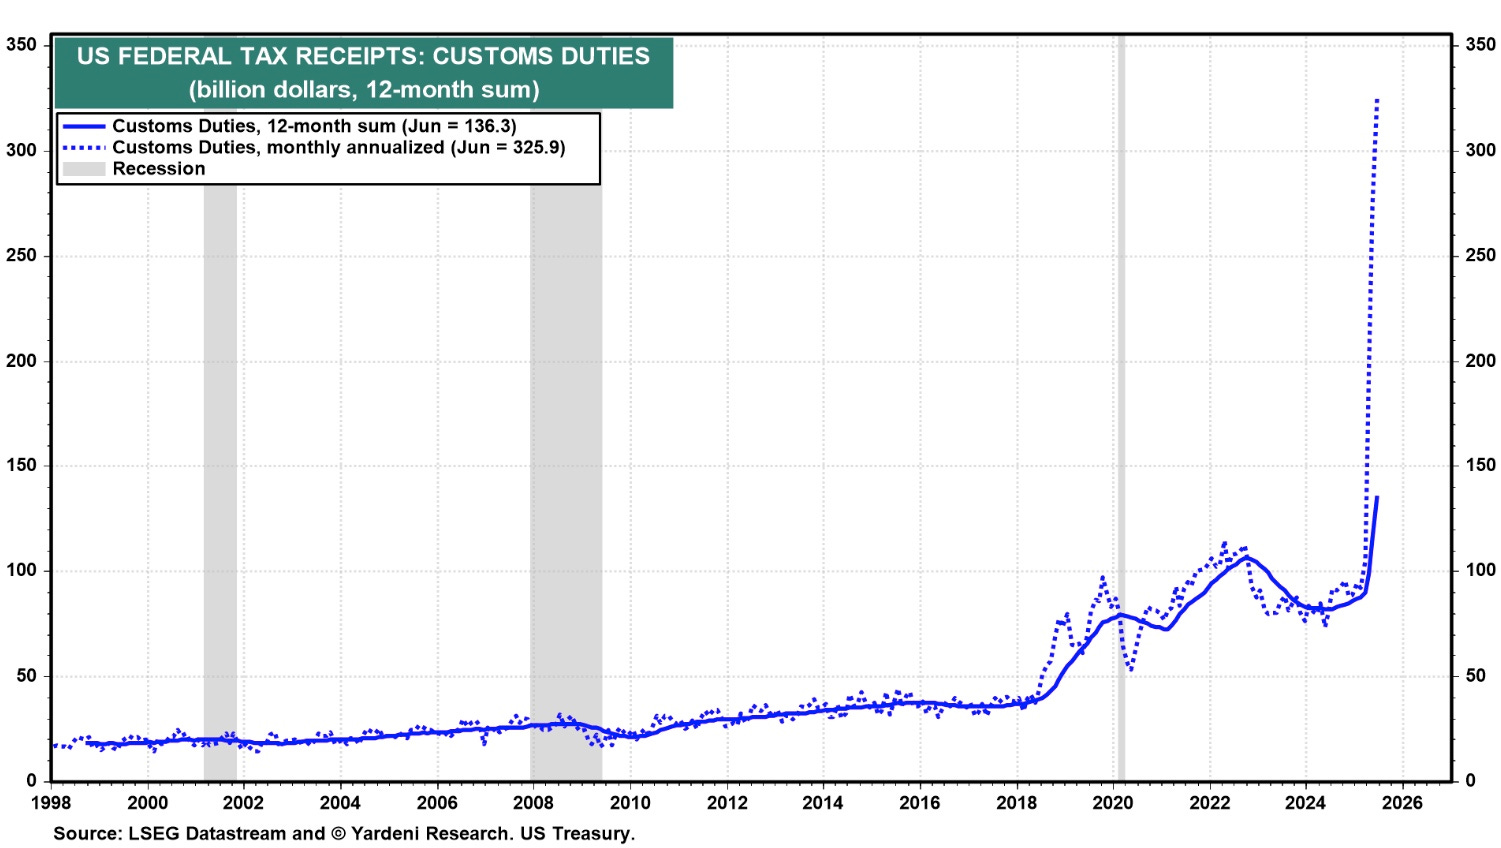
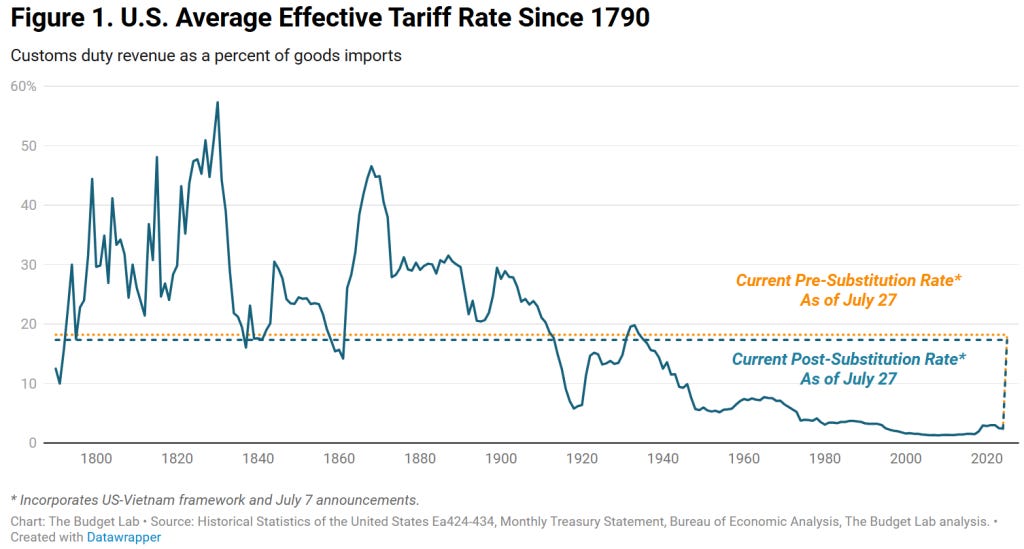
We haven’t seen tariff rates this high since pre-WWII days, so we’re in uncharted territory here.
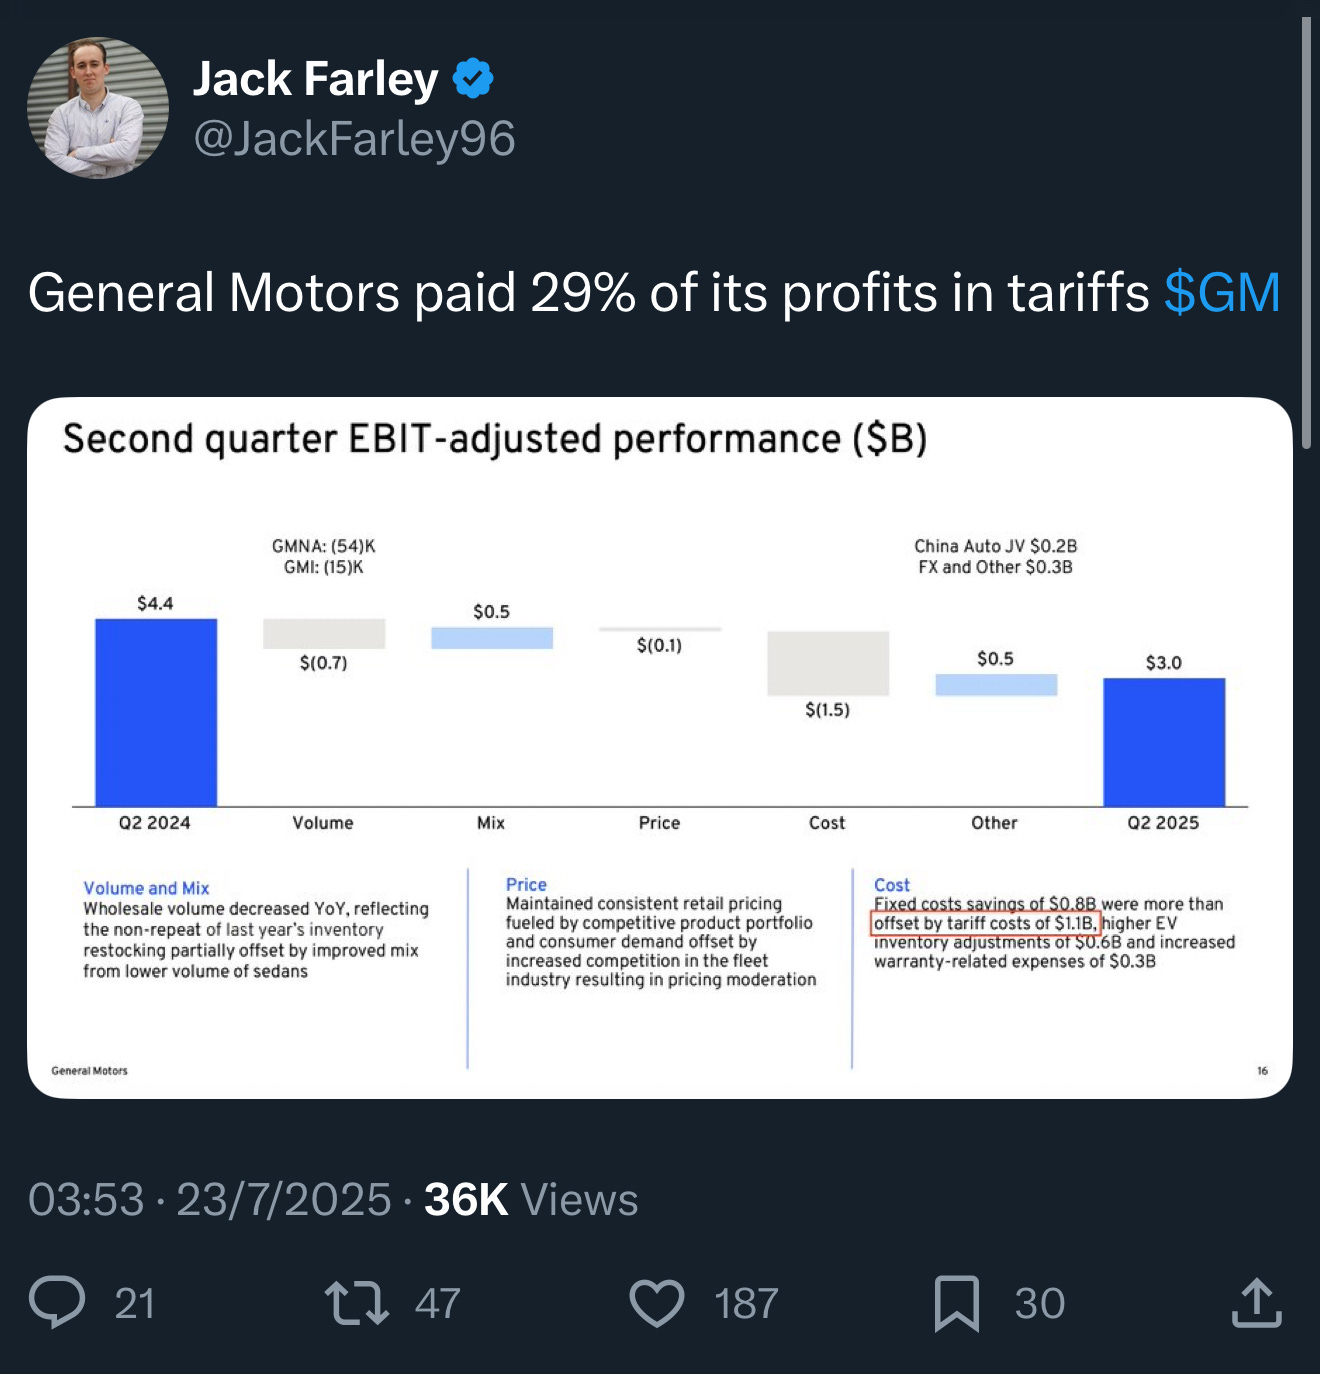
The burden’s likely split between exporters, importers, and consumers. Some sectors—manufacturing, automotive, clothing—are more exposed, while agriculture and tech are better off. Pricing power’s the key: highly competitive industries with no moat eat the costs at the corporate level; those with strong pricing power, like tech, pass it on to consumers.
Example: General Motors paid 29% of its profits in tariffs ($GM).
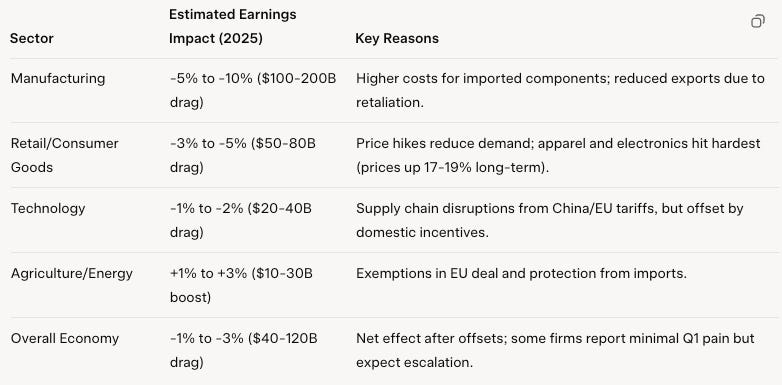
The table below summarizes the impact on corporate earnings for each sector:
Is the tariff drag big enough to tip the economy into a recession? Let’s put it in context: total US corporate earnings (profits before tax, annualized) are estimated at around $4.0 trillion for 2025. A $325 billion drag from tariffs is no small potatoes for corporate earnings, but don’t forget, this cost gets diluted across consumers too. And the US consumer? They’ve got deep pockets—Personal Disposable Income is projected at $22 trillion for 2025. That’s more than enough buffer to soak up the inflation shock from tariffs.
Overall, the impact on nominal GDP in 2025 is expected to be modestly negative to flat, with projections showing a 0.5% to 1% drop from the baseline (around $28–29 trillion nominal GDP without tariffs).
This is roughly what the economists are pricing:
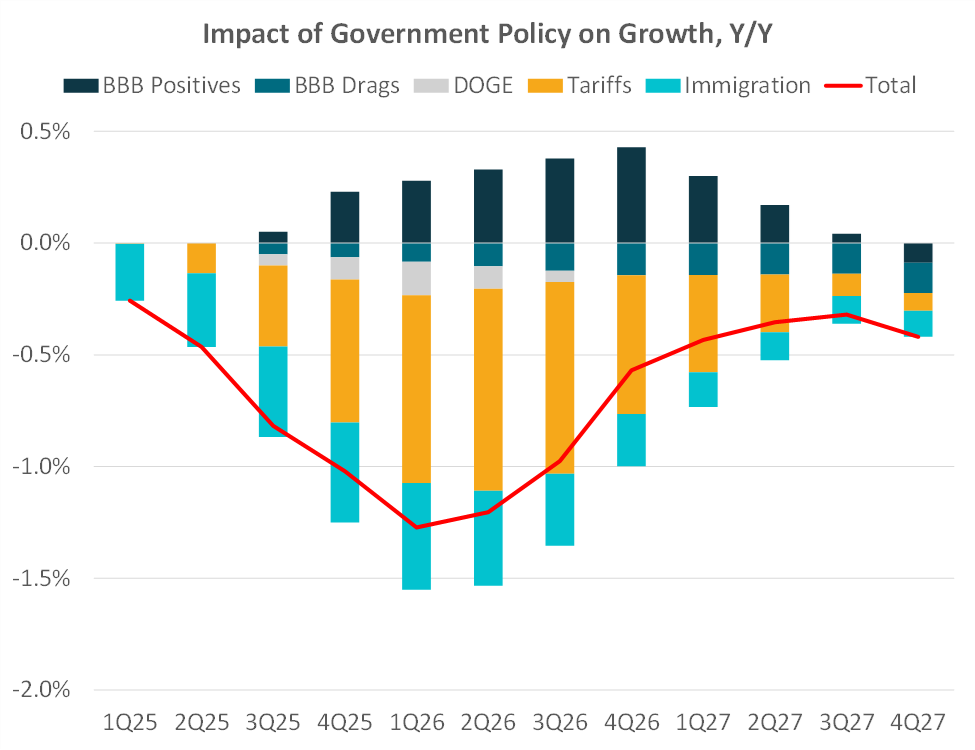
Now, what about the One Big Beautiful Bill (OBBB), DOGE, and immigration?
Immigration often gets overlooked, but it was a big driver during Bidenomics, pushing growth to a high plateau. Cutting immigration has two effects: it loosen up the labor market while slowing growth. Large-scale immigration is famous for boosting total GDP but dragging down capital per capita. We’re likely to see the reverse now: a tighter labor market, slower growth, but rising capital per capita.
The below chart is an attempt from Bob Eliott to quantify all the impacts.
And here, my friends, is the main argument of the macro bears. A small cohort of macro influencers and traders on X is max bearish on the US stock market right now.
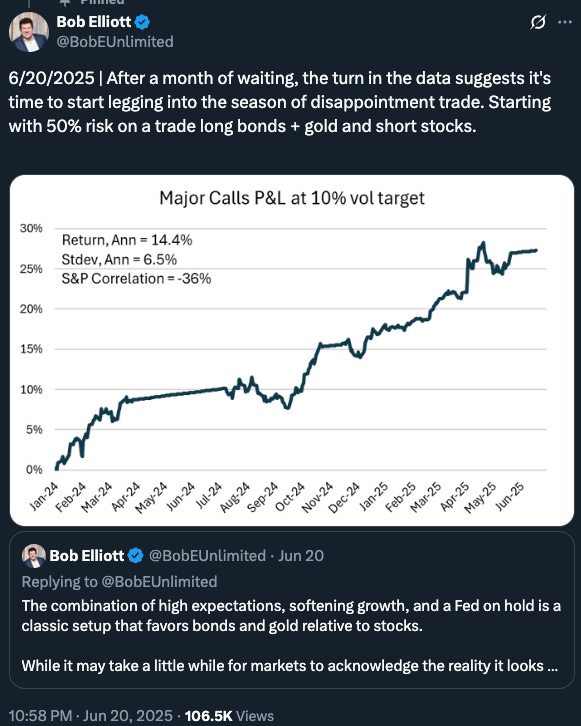
Andy Constan, another macro guy, ran this survey because he thinks the fiscal impulse is fading—“run it hot” has peaked.
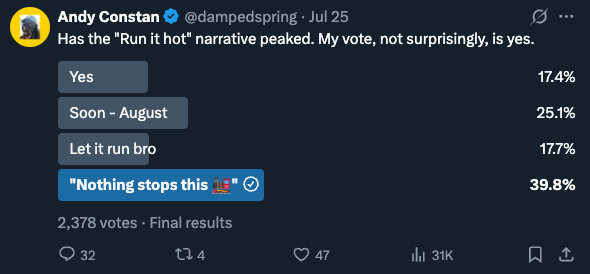
The results of that survey are fascinating: “nothing stops this train” (aka run it hot) is the consensus view. This narrative might be peaking, but trying to time the top and short pro-nominal growth assets (like stocks) is a fool’s errand. I wholeheartedly agree that Trump’s policies will drag growth over the next 12 months—the math is clear, and economists are all on board. But the market doesn’t care yet. It might someday, but not now. Don’t go full macro bearish just because a soft patch is coming. Be patient, don’t fight the tape—let it tell you when the slower growth starts getting priced in. That’s when you go hard on shorts.
Finally, the negative fiscal impulse is super sector-dependent. Tech, the big dog, seems mostly unaffected by tariffs and immigration. I’d even argue OBBB could be a tailwind for Big Tech, helping finance their massive AI capex.
→ Updating the Fiscal Category to a negative outlook: Bidenomics are over; Trump’s (mis)policies are here to stay. The direct result of this negative outlook is also downgrading the Growth category from positive to neutral.
Liquidity
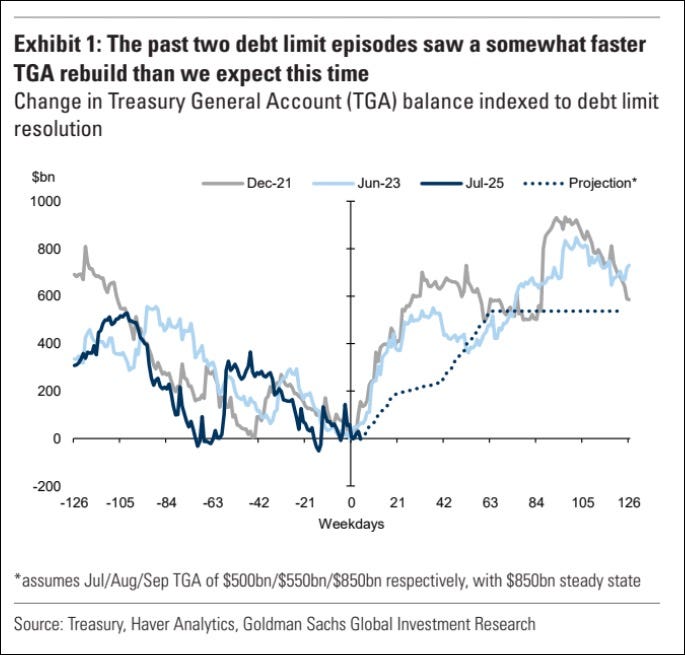
US Liquidity: The proxy index is flat. I was expecting Treasury Secretary Bessent to start refilling the Treasury General Account (TGA), but nope—they’re keeping liquidity high. Tomorrow’s Quarterly Refunding Announcement (QRA) should shed light on the schedule and bill-bond mix.


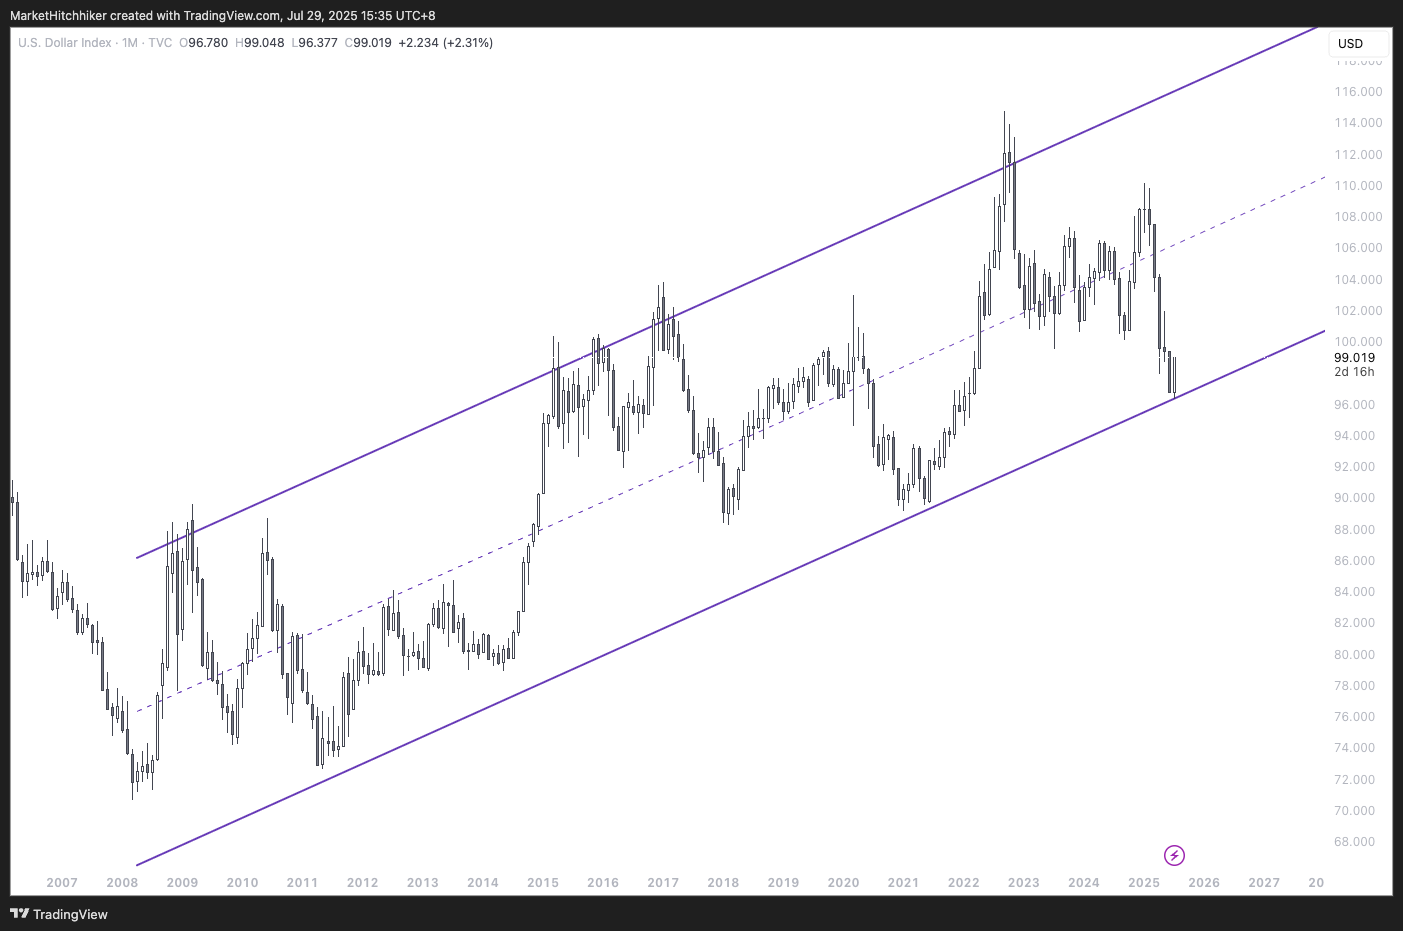
Global Liquidity: Both the global liquidity index and bitcoin are at all-time highs. But watch out—a dollar rally could spoil the party. DXY’s sitting at the low end of a long-term range.
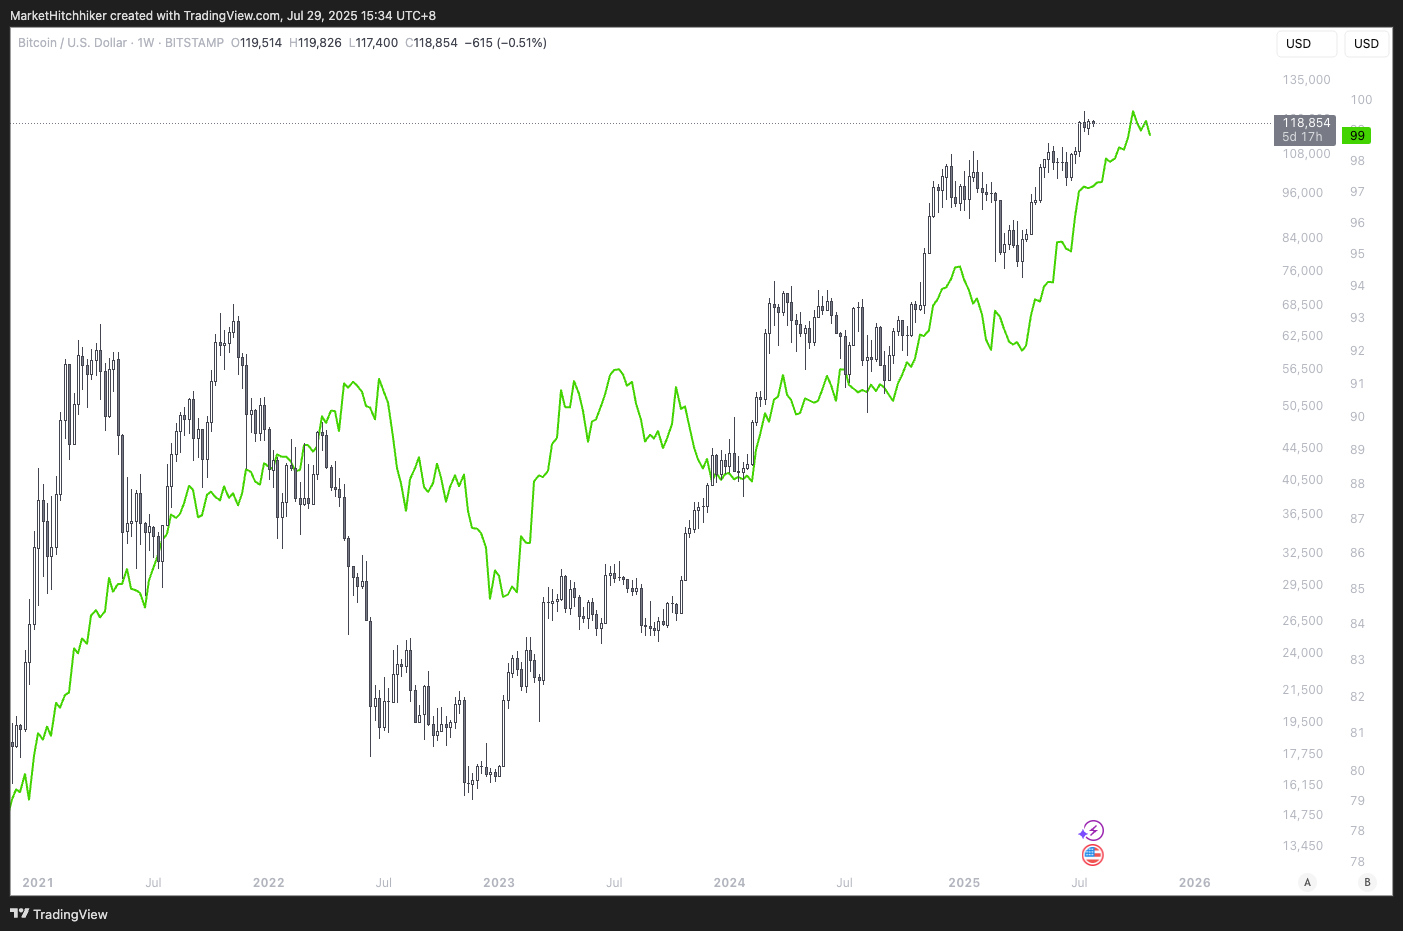
Bitcoin (candlesticks) and Global Liquidity Proxy Index (Green) lagged by -3 months 
DXY

→ No update for the Liquidity category, but a heads-up: Refilling the TGA and a potential US dollar rally could dampen the liquidity impulse, possibly triggering a correction in bitcoin and risk assets.
Conclusion
Here’s the big question on my mind: Is the market looking past the forecasted slowdown in H2-2025 and 2026? A negative fiscal impulse, if not offset by loose credit and stimulative monetary policy, should pull stocks down, right? Or is the market just riding a wave of retail money pouring into big tech and anything AI-related?
I build my outlook around three axes: fundamentals, positioning, flows, and sentiment. Fundamentals drive earnings; everything else sets the multiplier—how much folks are willing to pay for those earnings.
Let’s dive into the fundamentals, starting with Earnings Per Share. Making money with fundamentals means measuring expectations and betting on whether they’ll be exceeded or missed. The first step to understanding those expectations is knowing where we’re coming from.
I believe it's hard to predict the future. It's not that hard to predict the present. In other words, it's not that hard to understand what's going on today.
Howard Marks
We’re coming off a pretty low bar for earnings. Q2-2025 earnings were set very low (thanks, Liberation Day), with just +4% year-over-year growth expected. Analysts’ pessimism created rock-bottom expectations, leading to big beats across the board this summer earnings season. It’s the final step in climbing the wall of worry built on Liberation Day.
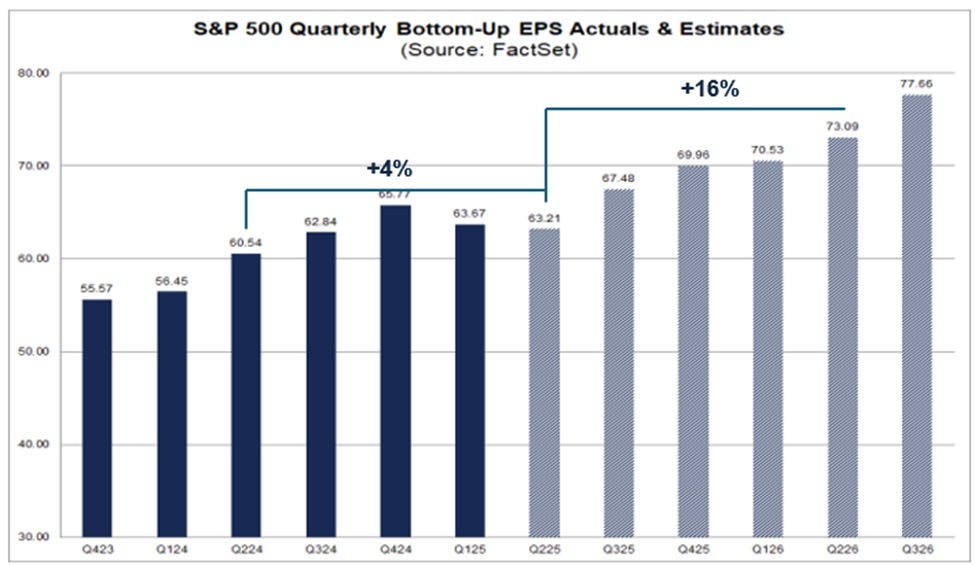
Looking ahead, the bar’s much higher. Q2-2026 is set at +16% year-over-year growth, well above the average EPS year-over-year growth of about 7% over the past 20 years.
In plain English, equity analysts were pretty pessimistic until now, but they’re flipping to overly optimistic for the next twelve months.
Read this twice.
Equity analysts were pretty pessimistic until now, but they’re flipping to overly optimistic for the next twelve months
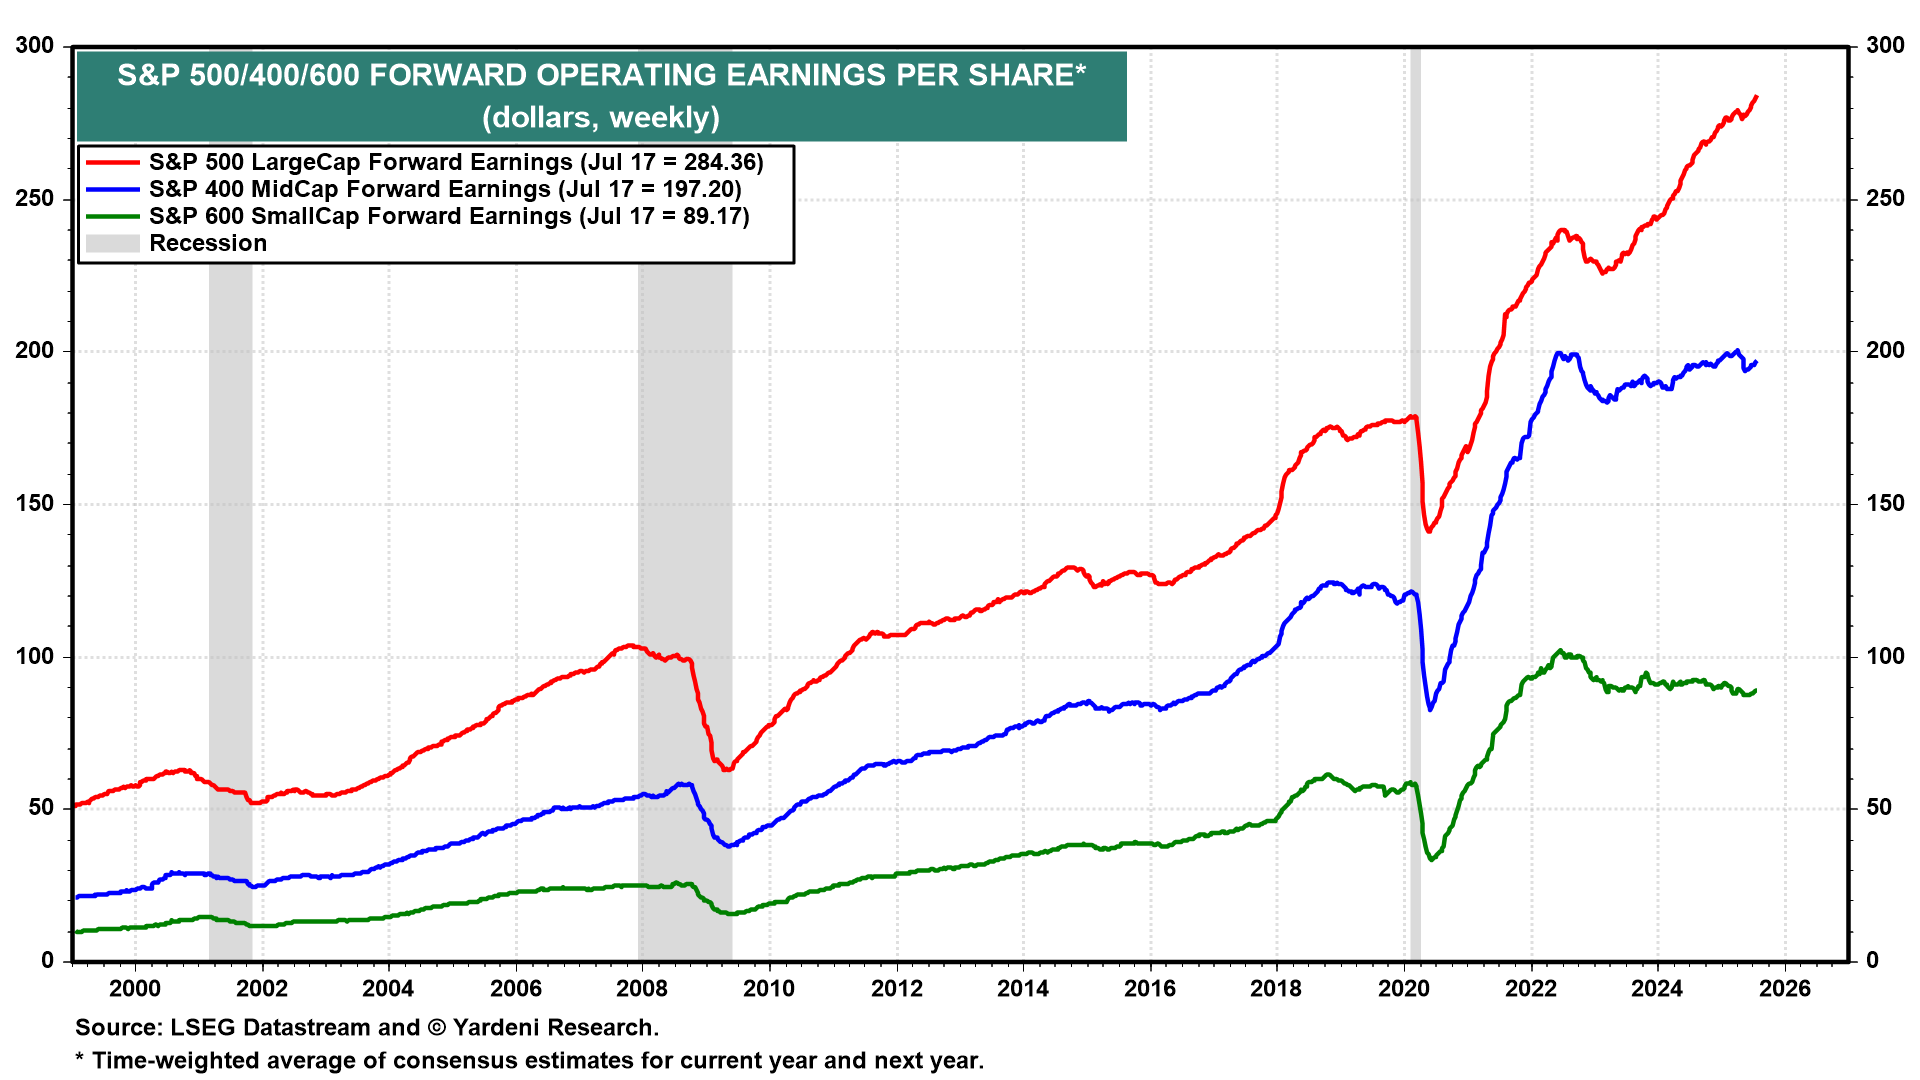
The picture isn’t complete if we only look at the index in aggregate. The US stock market is K-shaped—big companies are grabbing more and more market share, choking off smaller ones. Check out the chart below on EPS for Large, Mid, and Small Caps. This trend’s been super sharp since 2023. With fiscal dominance, fear of debasement, and AI mania, money’s rushing to large, liquid companies with strong pricing power—think monopolies like Big Tech. It’s winner-takes-all out there.
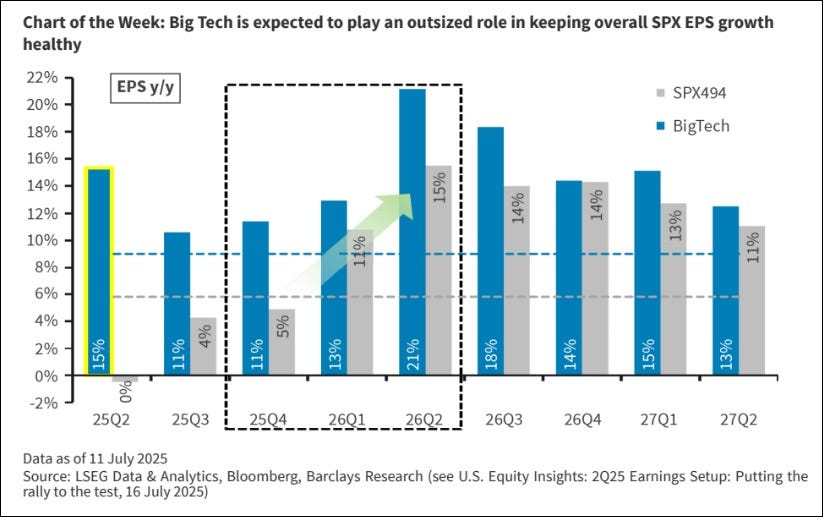
Zooming into the S&P 500, there’s a huge gap between the SPX494 and Big Tech. Most of the growth this quarter has come from Big Tech, and it’s priced to keep rolling into 2026 before converging. Expectations for Big Tech over the next twelve months are sky-high: from 11% growth in Q4-2025 to 21% in Q2-2026. The bar’s being raised even higher for these giants.
In conclusion, there’s a disconnect between macro economists expecting slower US economic growth next year and equity analysts betting on strong earnings growth. These two realities can’t coexist—one’s gotta give.
Either the slowdown fears are overstated, and the economy will keep humming along, or the earnings forecasts are way too optimistic, and the S&P 500 is due for a correction.
One thing I know for sure: the tailwind of low earnings expectations is over for US stocks, recession or not. Equity analysts are now overly optimistic—contra alert!—and even Mike Wilson’s calling for a melt-up.
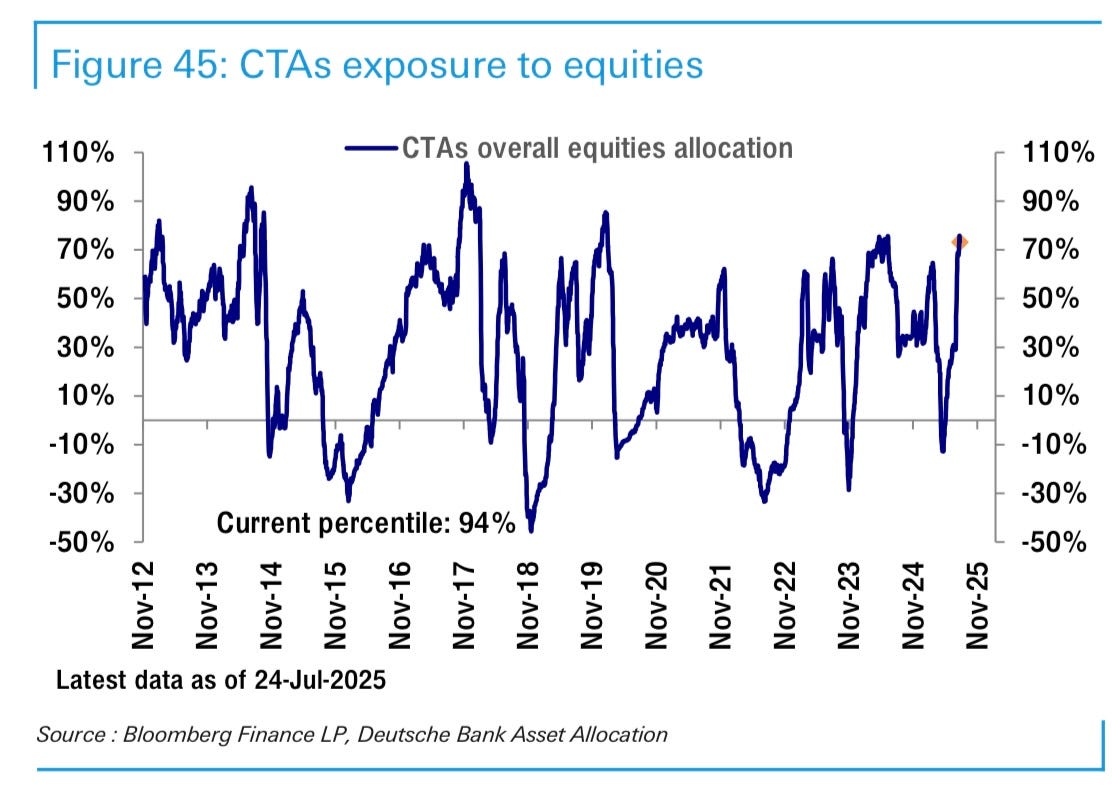
Now let’s talk flows & positioning. As often—though not always—positioning follows price. A melt-up in the US stock market is driving a big catch-up in equity positioning. We’re not back to max levels yet, but we’re getting close.
CTAs are close to max long:
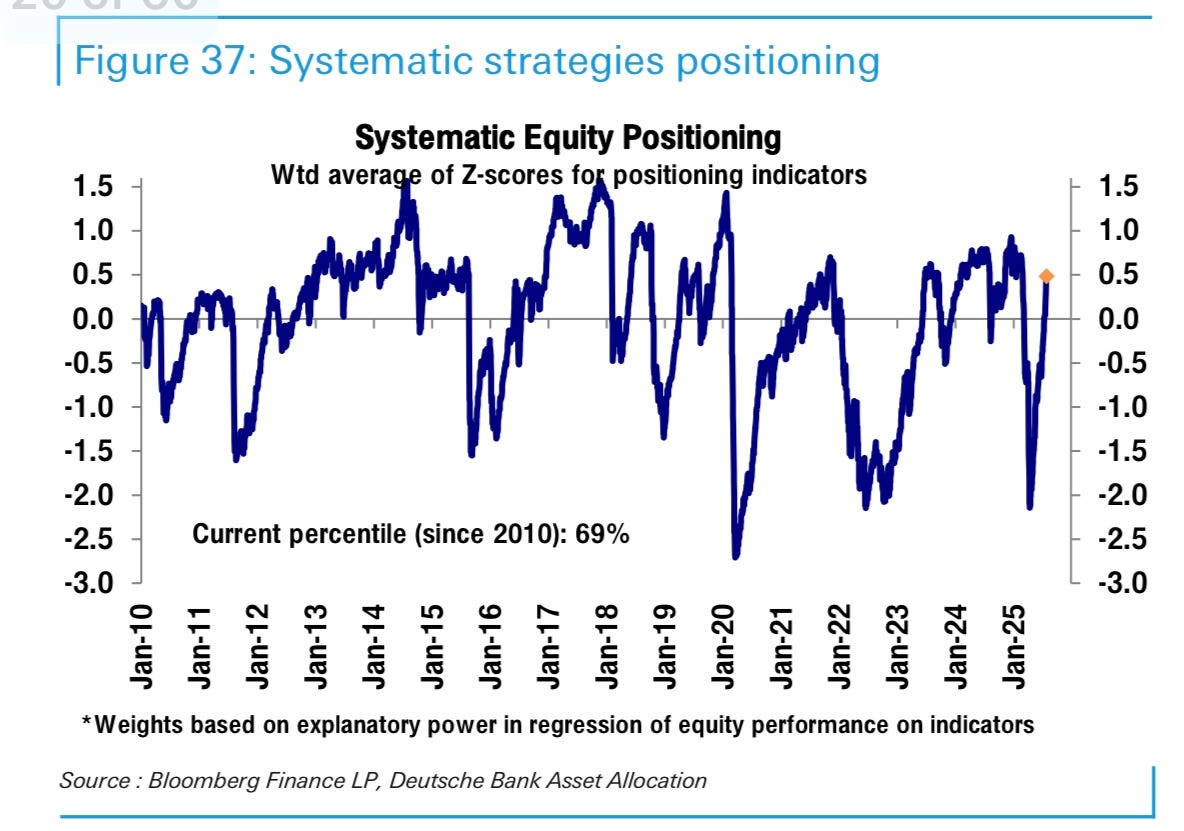
And Vol-Control funds are very close too:
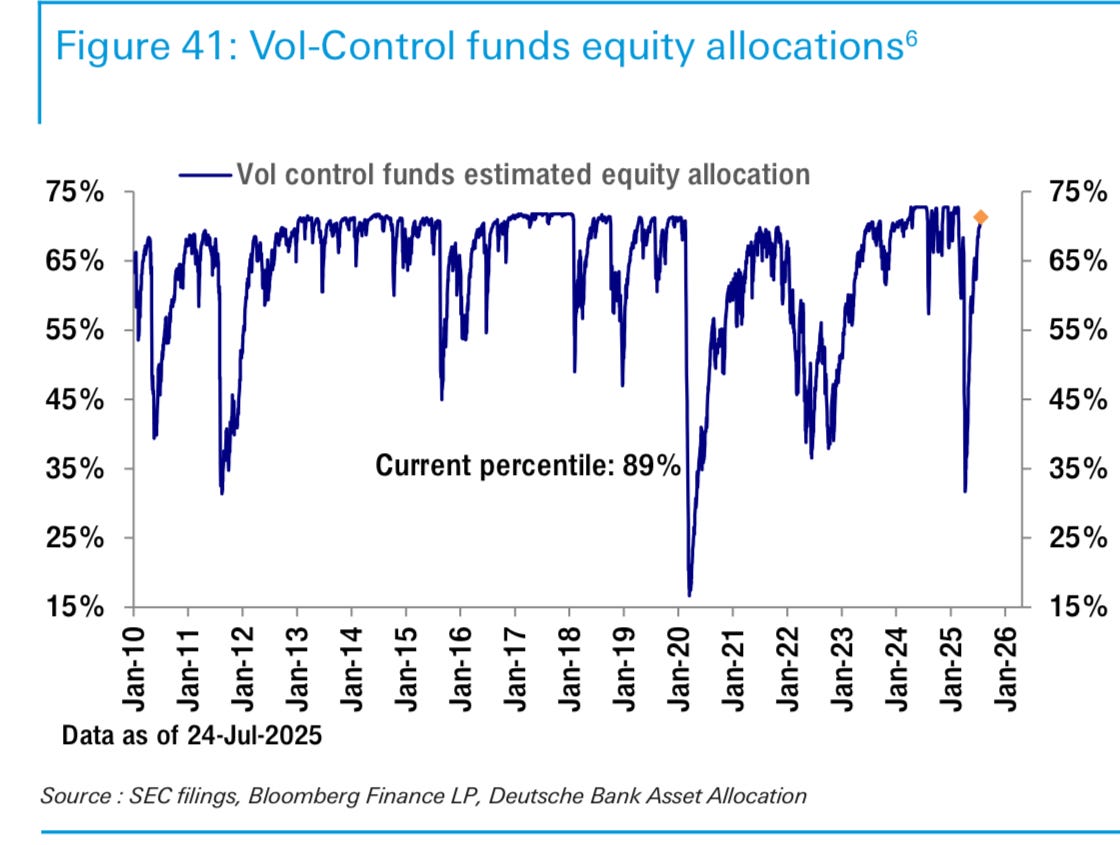
Give it another week or two, and positioning will be max crowded on the long side.
Remember Liberation Day when the S&P 500 tanked alongside the US dollar? Everyone was screaming “End of US Exceptionalism!” Every day, there was a new post on X or Substack about capital repatriation from the US to Europe and Japan: “Sell US stocks, buy EU and JP stocks!”
Well…
We love spinning nice stories, especially when cross-asset correlations flip, but maybe that’s all they are—just stories.
The latest Treasury data on US Net Capital Inflows is mind-blowing: foreign investors have been buying the dip in massive amounts. This is just insane to me. Maybe Liberation Day was just a warm-up? I’m speechless—this is the greatest flow bubble I’ve ever seen. Good luck timing the top, but historically, foreign investors are scarily good at piling into US stocks right around a market peak.

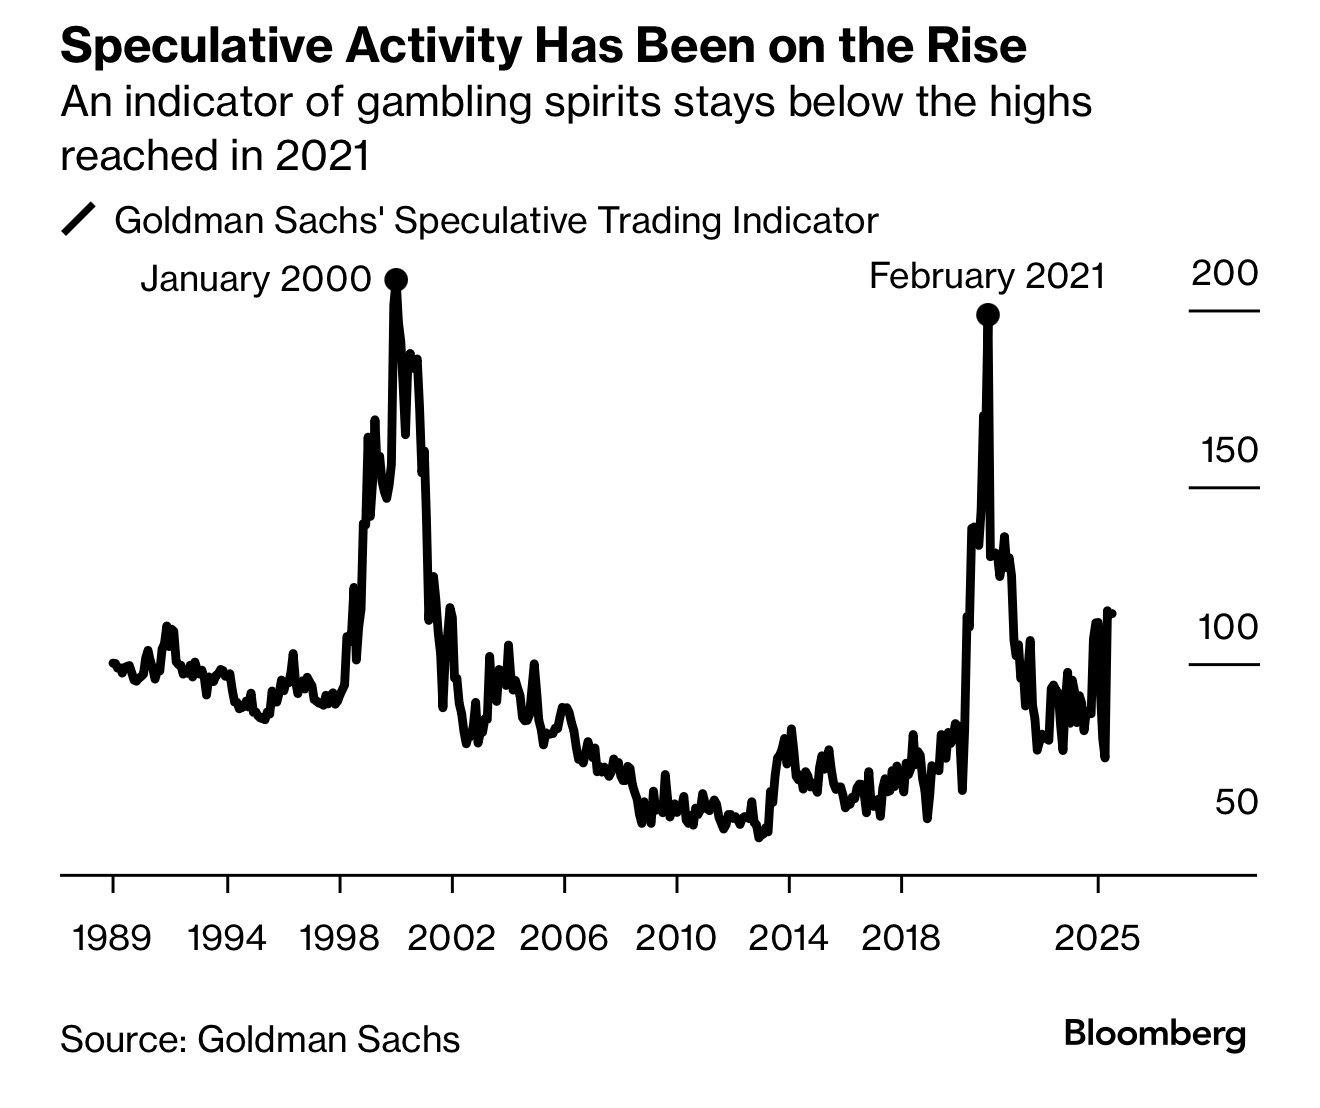
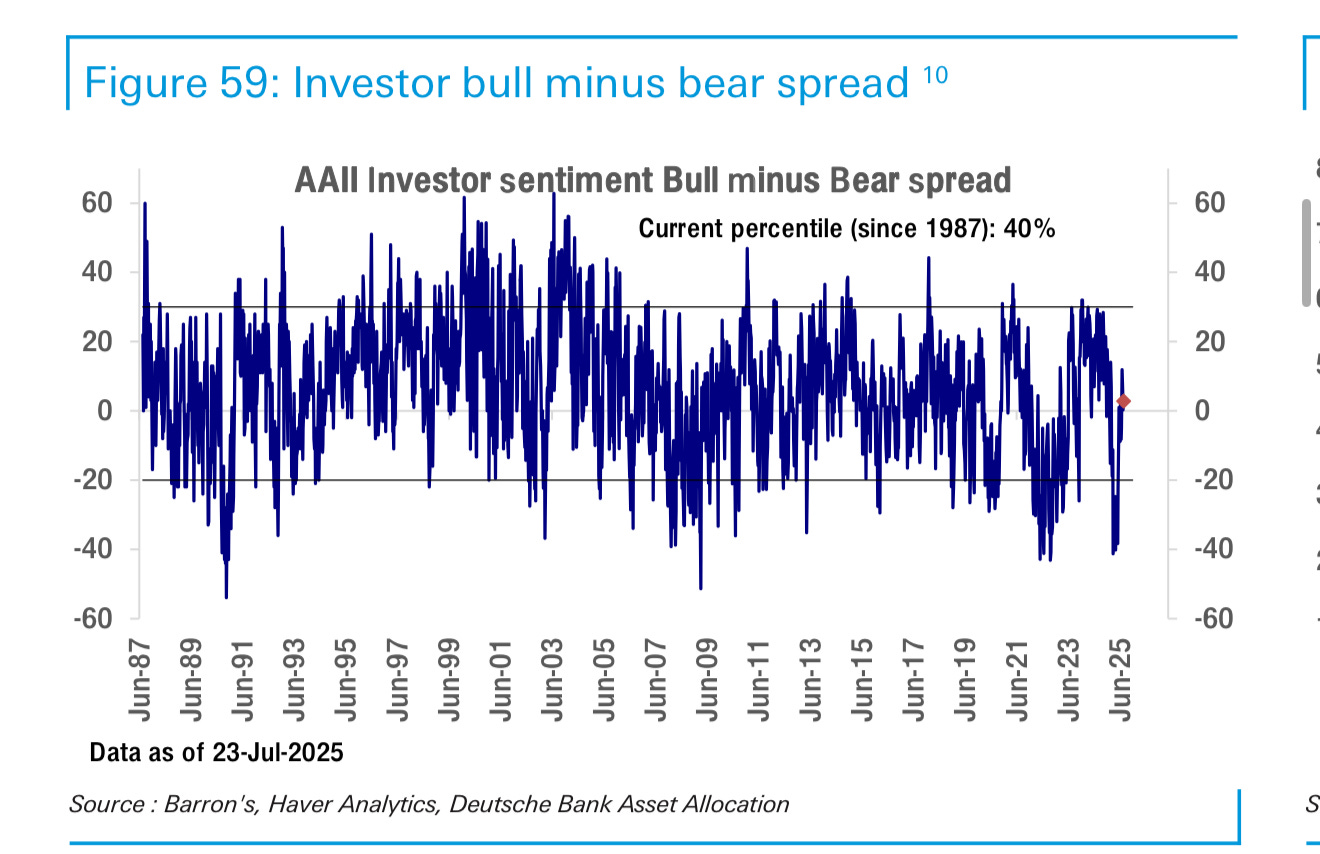
Sentiment is interesting right now. With stocks at all-time highs, bitcoin and Ethereum shooting to the moon, and meme stocks ripping here and there, you’d think euphoria’s everywhere. You’re not wrong, but we’re still far from extreme levels.
You’ve probably seen this chart before: the newly minted Goldman Sachs Speculative Activity Index. It’s had a crazy spike in the past couple of months, but we’re nowhere near the madness of the dot-com bubble or COVID meme stock craze.
And more importantly, Goldman Sachs dropped this gem:
Historically, spikes in speculative trading have preceded strong 3-, 6-, and 12-month S&P 500 returns, but also below-average returns on a two-year horizon.
Momentum begets momentum…
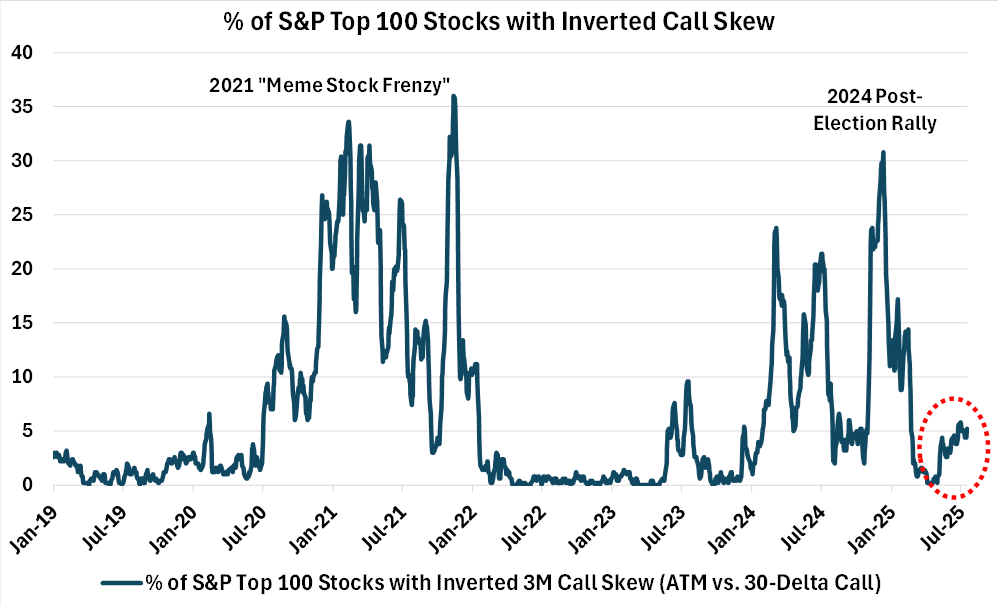
Different metric, same conclusion from CBOE, the current meme mania is just an idiosyncratic phenomenon.
There’s a ton of positive sentiment, but it can get much, much, much stupider.
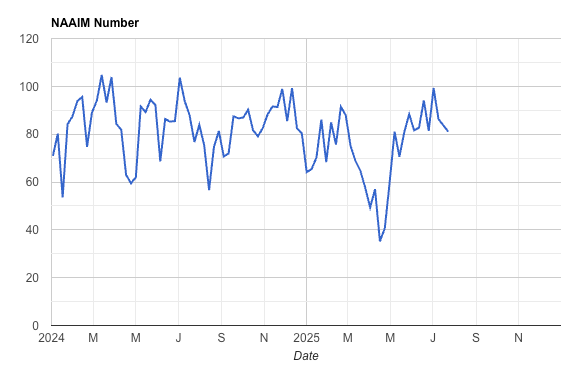
Both AAII and NAAIM are showing mild readings.
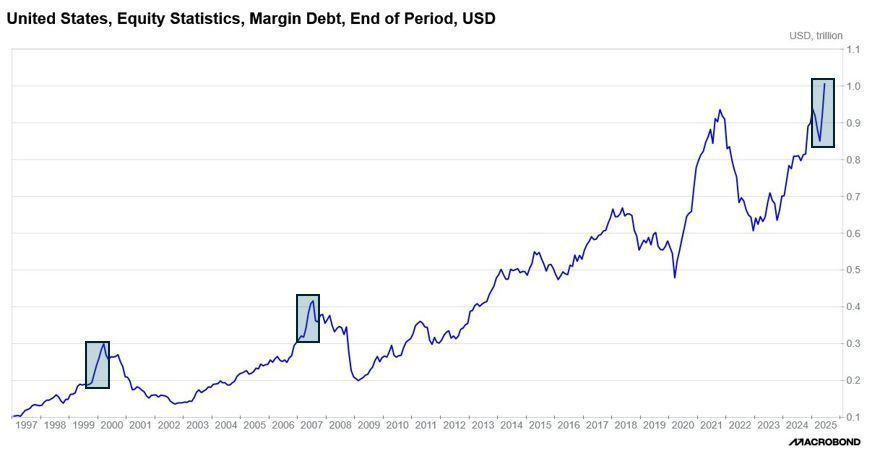
Margin debt’s climbing too, but who knows if it’s the top? One thing’s for sure: we’re in a speculative environment. Trump kicked off his presidency by issuing a meme coin—what did you expect?
I found this comment from a moderately successful X account that nails the zeitgeist: the market’s frothy, but you ain’t seen nothing yet. We’re barely dipping our toes into bubble territory.
Of course this is not the kind of theory you see at the bottom of the market. One shall remember that a market is going parabolic when starting from an overbought position.
To wrap up, the market’s super frothy right now, fundamentals are hitting a ceiling, positioning should be crowded in a couple of weeks, systematic flow from Vol Control funds and CTA should stop anytime soon. Finally sentiment is stretched but it could get much more stupid. Long story short, the risk reward on US stock is not great. This being said, different traders need different plays.
A rational buy-and-hold investor should eye the fundamental headwinds coming at year-end but recognize that, without a catalyst, flows and sentiment mean equities are still headed up. Implied volatility’s dirt cheap—buy those hedges now, not when you’re panicking. December 2025 SPX puts are a steal here. With the fiscal impulse slowing and equity analysts getting overly optimistic, the left tail’s looking fat, while upside’s capped—we’re already at 22x forward P/E, and trees don’t grow to the sky. Now’s a good time to pick single stocks you’re convicted about, especially those with an AI tailwind. That way, you’ve got a shot to outperform if we hit AI bubble territory.
A risk-averse investor shouldn’t sit in cash. Instead, go for low-volatility equities. I’m loving Berkshire Hathaway ($BRK.B) at these levels—it’s the perfect defensive play to ride out a weaker H2-2025 economy.
Volatility traders should harvest while he can the short-term volatility premium on SPX and reinvest the carry into Dec ‘25 or Jun ‘26 tail-risk hedges. The left tail’s probably mispriced.
Momentum traders, get ready for a possible AI mania like it’s the dot-com days. Build your list of high-growth, unprofitable AI stocks and buy breakouts on high volume. Keep it simple.
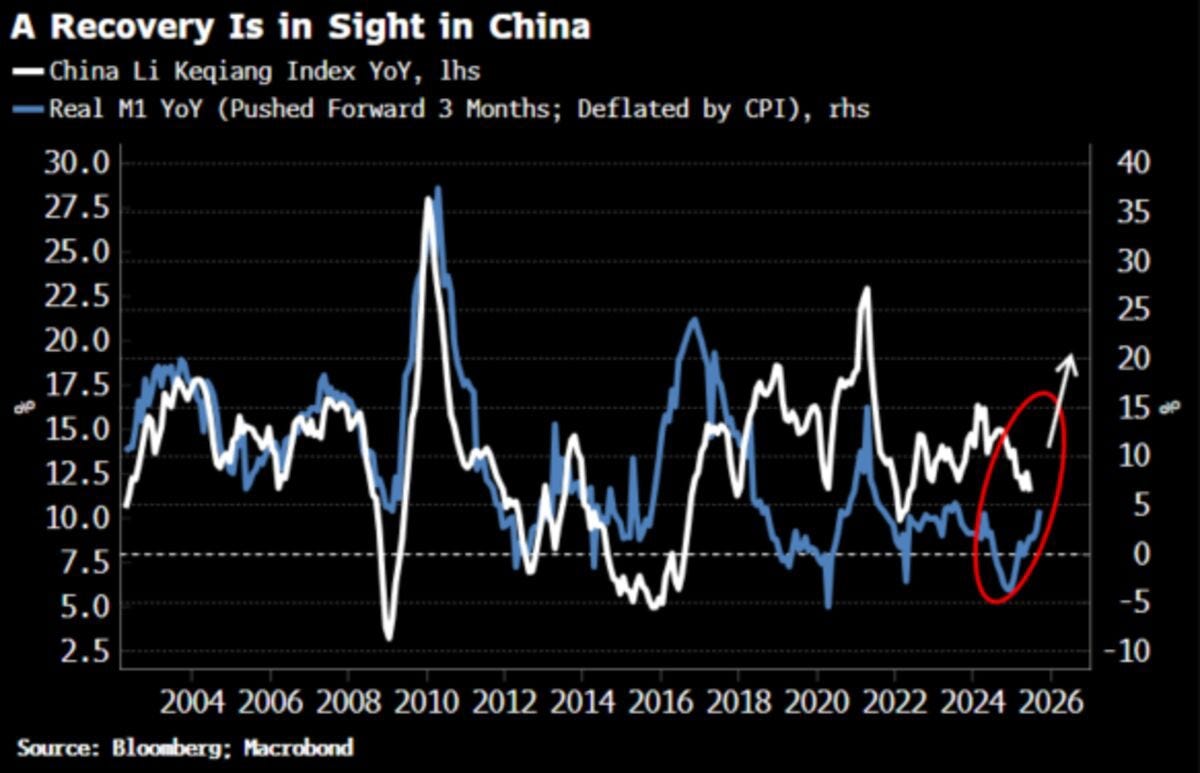
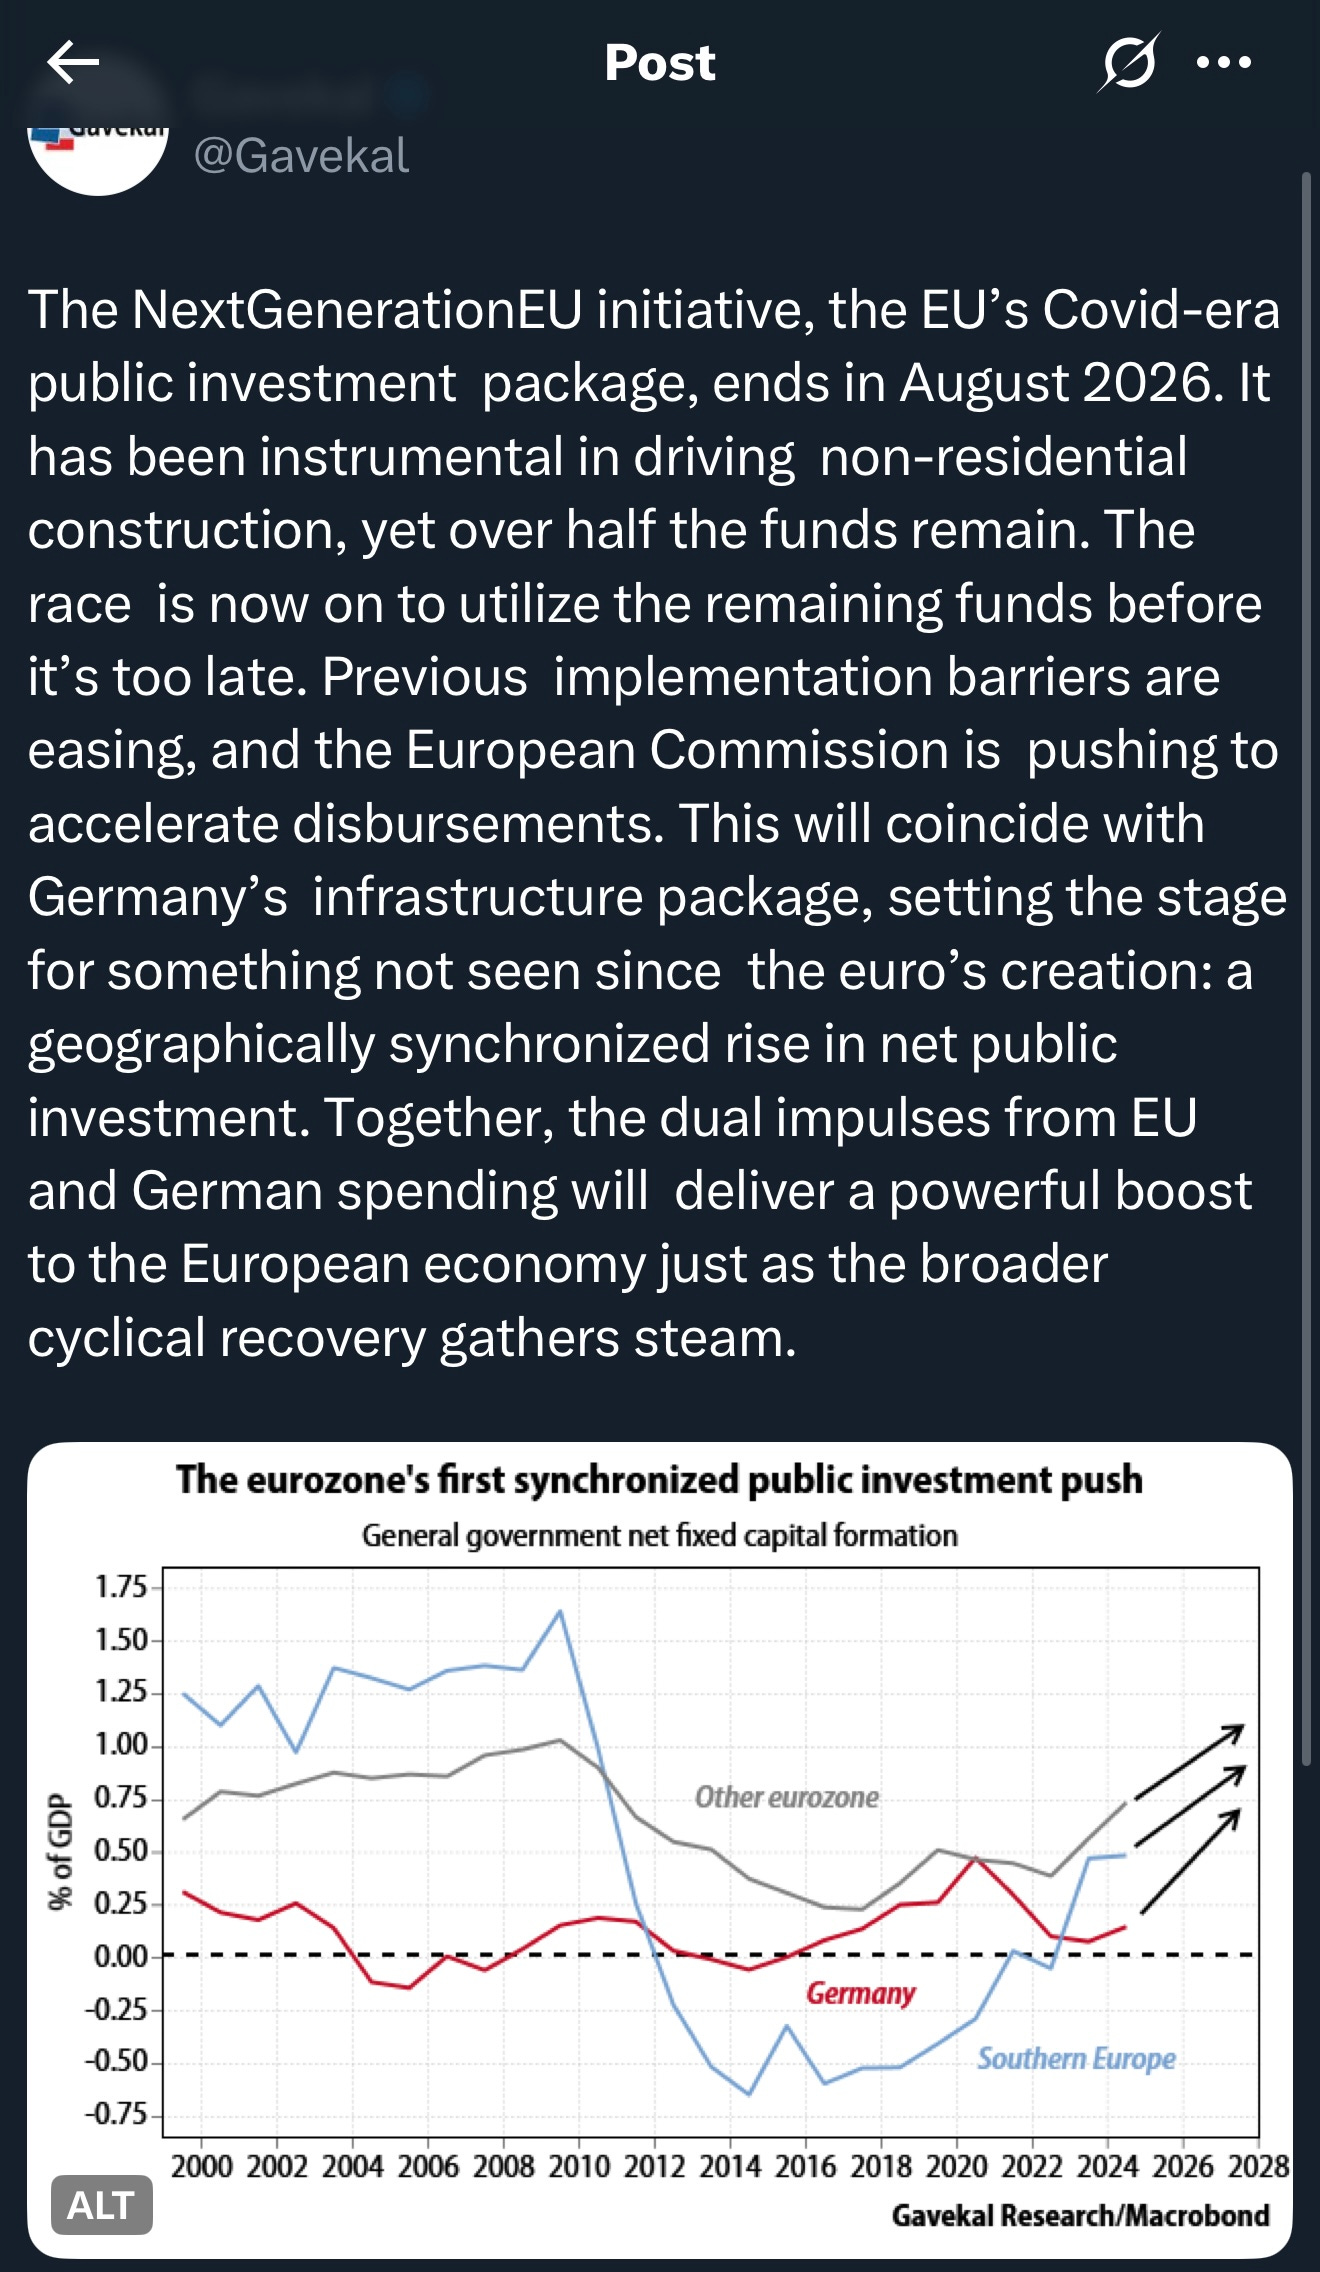
Beta-neutral or macro traders should jump on the pullback in European stocks to go long Eurostoxx futures, short SPX futures. I also think long China, short US is a winner. The thesis? Negative fiscal impulse in the US, positive in Europe and China. KISS — Keep It Stupid Simple
And listen up: nobody should be FOMOing into high-growth tech stocks without a stop-loss and profit target. Otherwise, you’ll ride the wave up and crash all the way down. There’s enough literature on fortunes made and lost in the dot-com bubble.
Personally, I’m running a mix: long a few selective stocks (details coming later for paid subs), long SX5E and HSCEI, short SPX, and very long gold at 3,300. If a slowdown starts getting priced in, gold’s gonna fly. It also nicely decorrelates with my long USD position from two weeks ago. I’ll revisit the USD thesis in an upcoming post.
That’s it for this week—stay safe!