
Macro Update #34.2
Part II: Monetary Policy, Fiscal Policy & Global Liquidity

This is Part II of the Macro Update. In Part I, we looked at growth, the labor market, and inflation. If you haven’t read it yet, follow the link below:
Macro Update #34.1

First, I would like to apologise for not having written any macro update in the past month. It is a time-consuming exercise, and I was uber-focused on delivering the web app, which has a much higher impact on my immediate trading results.
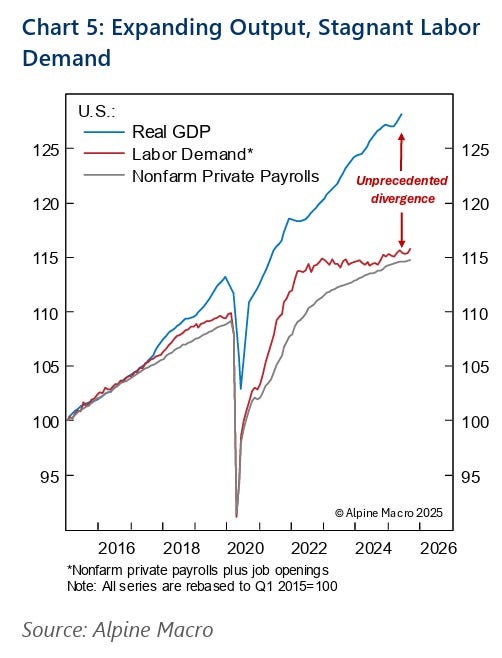
The puzzling aspect of the US economy at the moment is strong growth paired with rising unemployment, albeit still at a low rate of 4.4%. This has paved the way for a goldilocks regime where earnings are growing while inflation is slowing down, thanks to cyclical forces. But we are reaching a tipping point where the goldilocks regime could be at risk of transitioning to a reflation regime where growth and yields will rise together. Let’s now take a look at monetary and fiscal policy.
Monetary Policy
The last FOMC meeting delivered little in the way of forward guidance. As widely expected, Fed officials left interest rates unchanged. They remain firmly data-dependent and offered no bold or surprising statements. Interestingly, Chair Powell noted that the labor market now appears more stable. This aligns with the analysis outlined in Part I: the balance of risks is no longer skewed toward the employment mandate but has now shifted toward a more even balance between the dual mandates of maximum employment and price stability.
The market did not react much to the news, with a muted response in the S&P 500 and the SOFR futures market. Somehow, we are still pricing in two cuts by the end of the year.
But of course, this has little importance after the appointment of Kevin Warsh as the new Fed Chairman. The market initially sold off on the news, which first filtered through Polymarket odds. All risk-on assets sold hard, driven by the U.S. 30-year yield shooting higher. This knee-jerk reaction from the market stems from the perceived hawkishness of Warsh. This narrative is pushed by some well-followed economists like Anna W(r)ong:


I find it particularly laughable to base your judgment on what someone said more than 15 years ago. The market followed this narrative upon the initial news release by selling risk-on assets, but we saw quite some mean reversion happening thereafter.
In any case, the SOFR market barely moved, and it actually even started to reprice the odds of cuts by the end of the year slightly higher, confirming Warsh’s loyalty toward Trump.
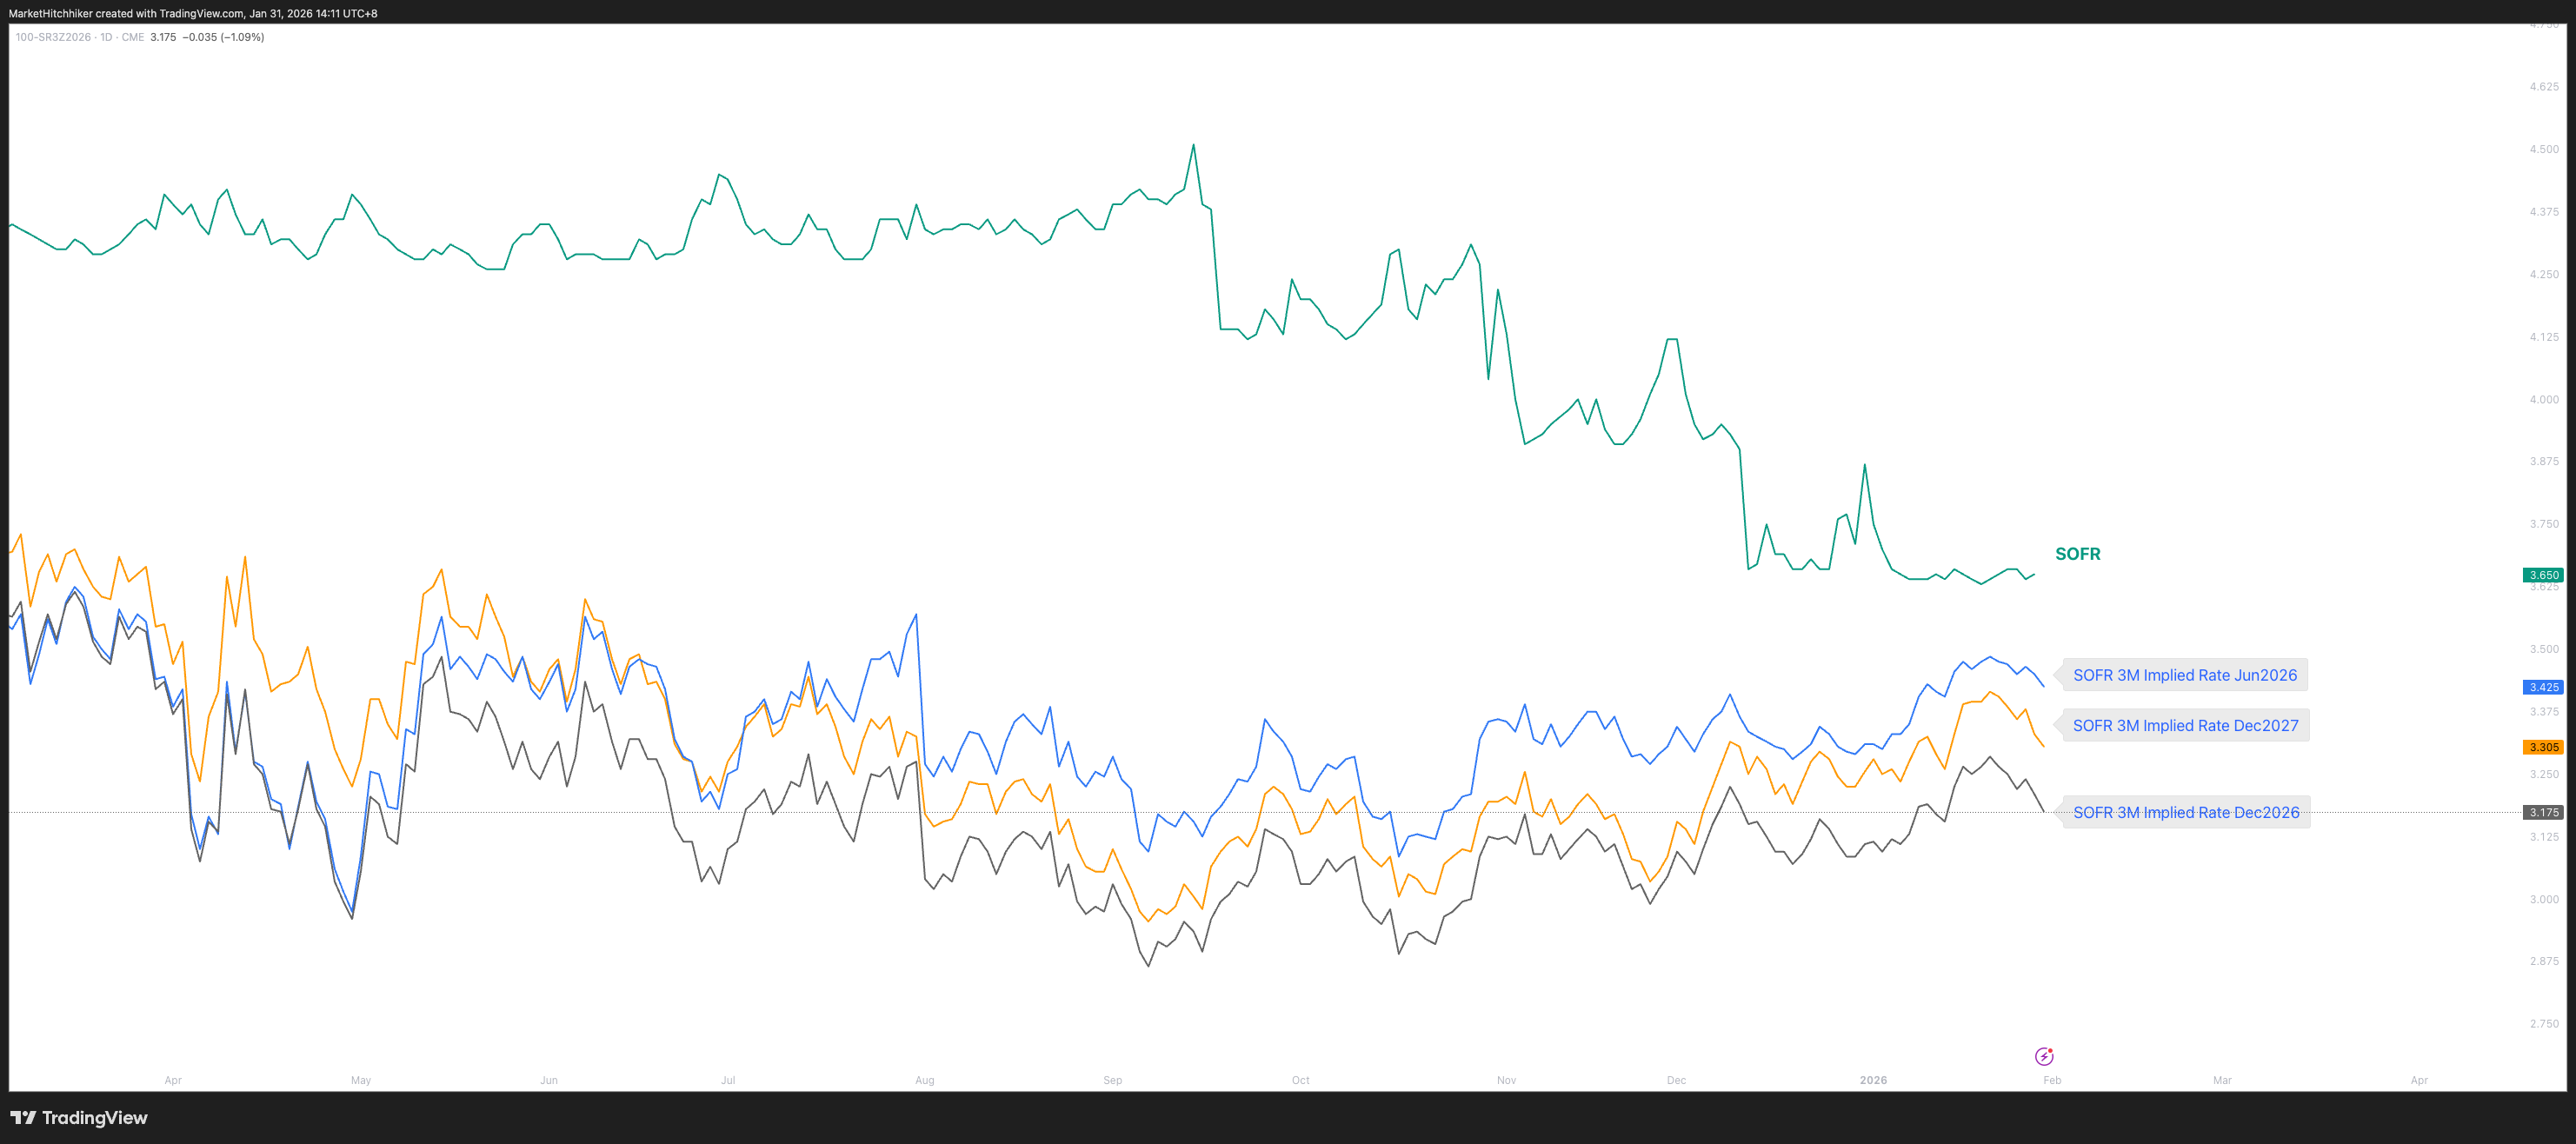
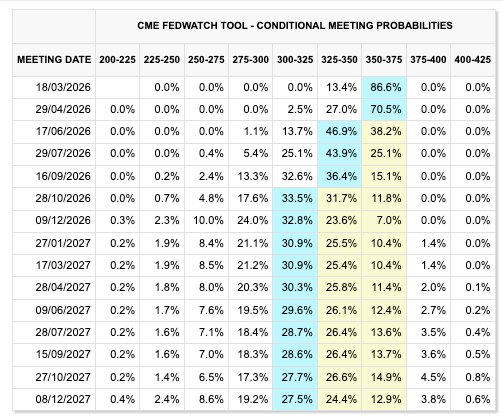
Currently, the SOFR futures Dec 2026 contract is implying a terminal rate close to 3.15%. It is indeed a terminal rate, as the market is pricing a higher rate in 2027, with the December 2027 contract pricing 3.30%.
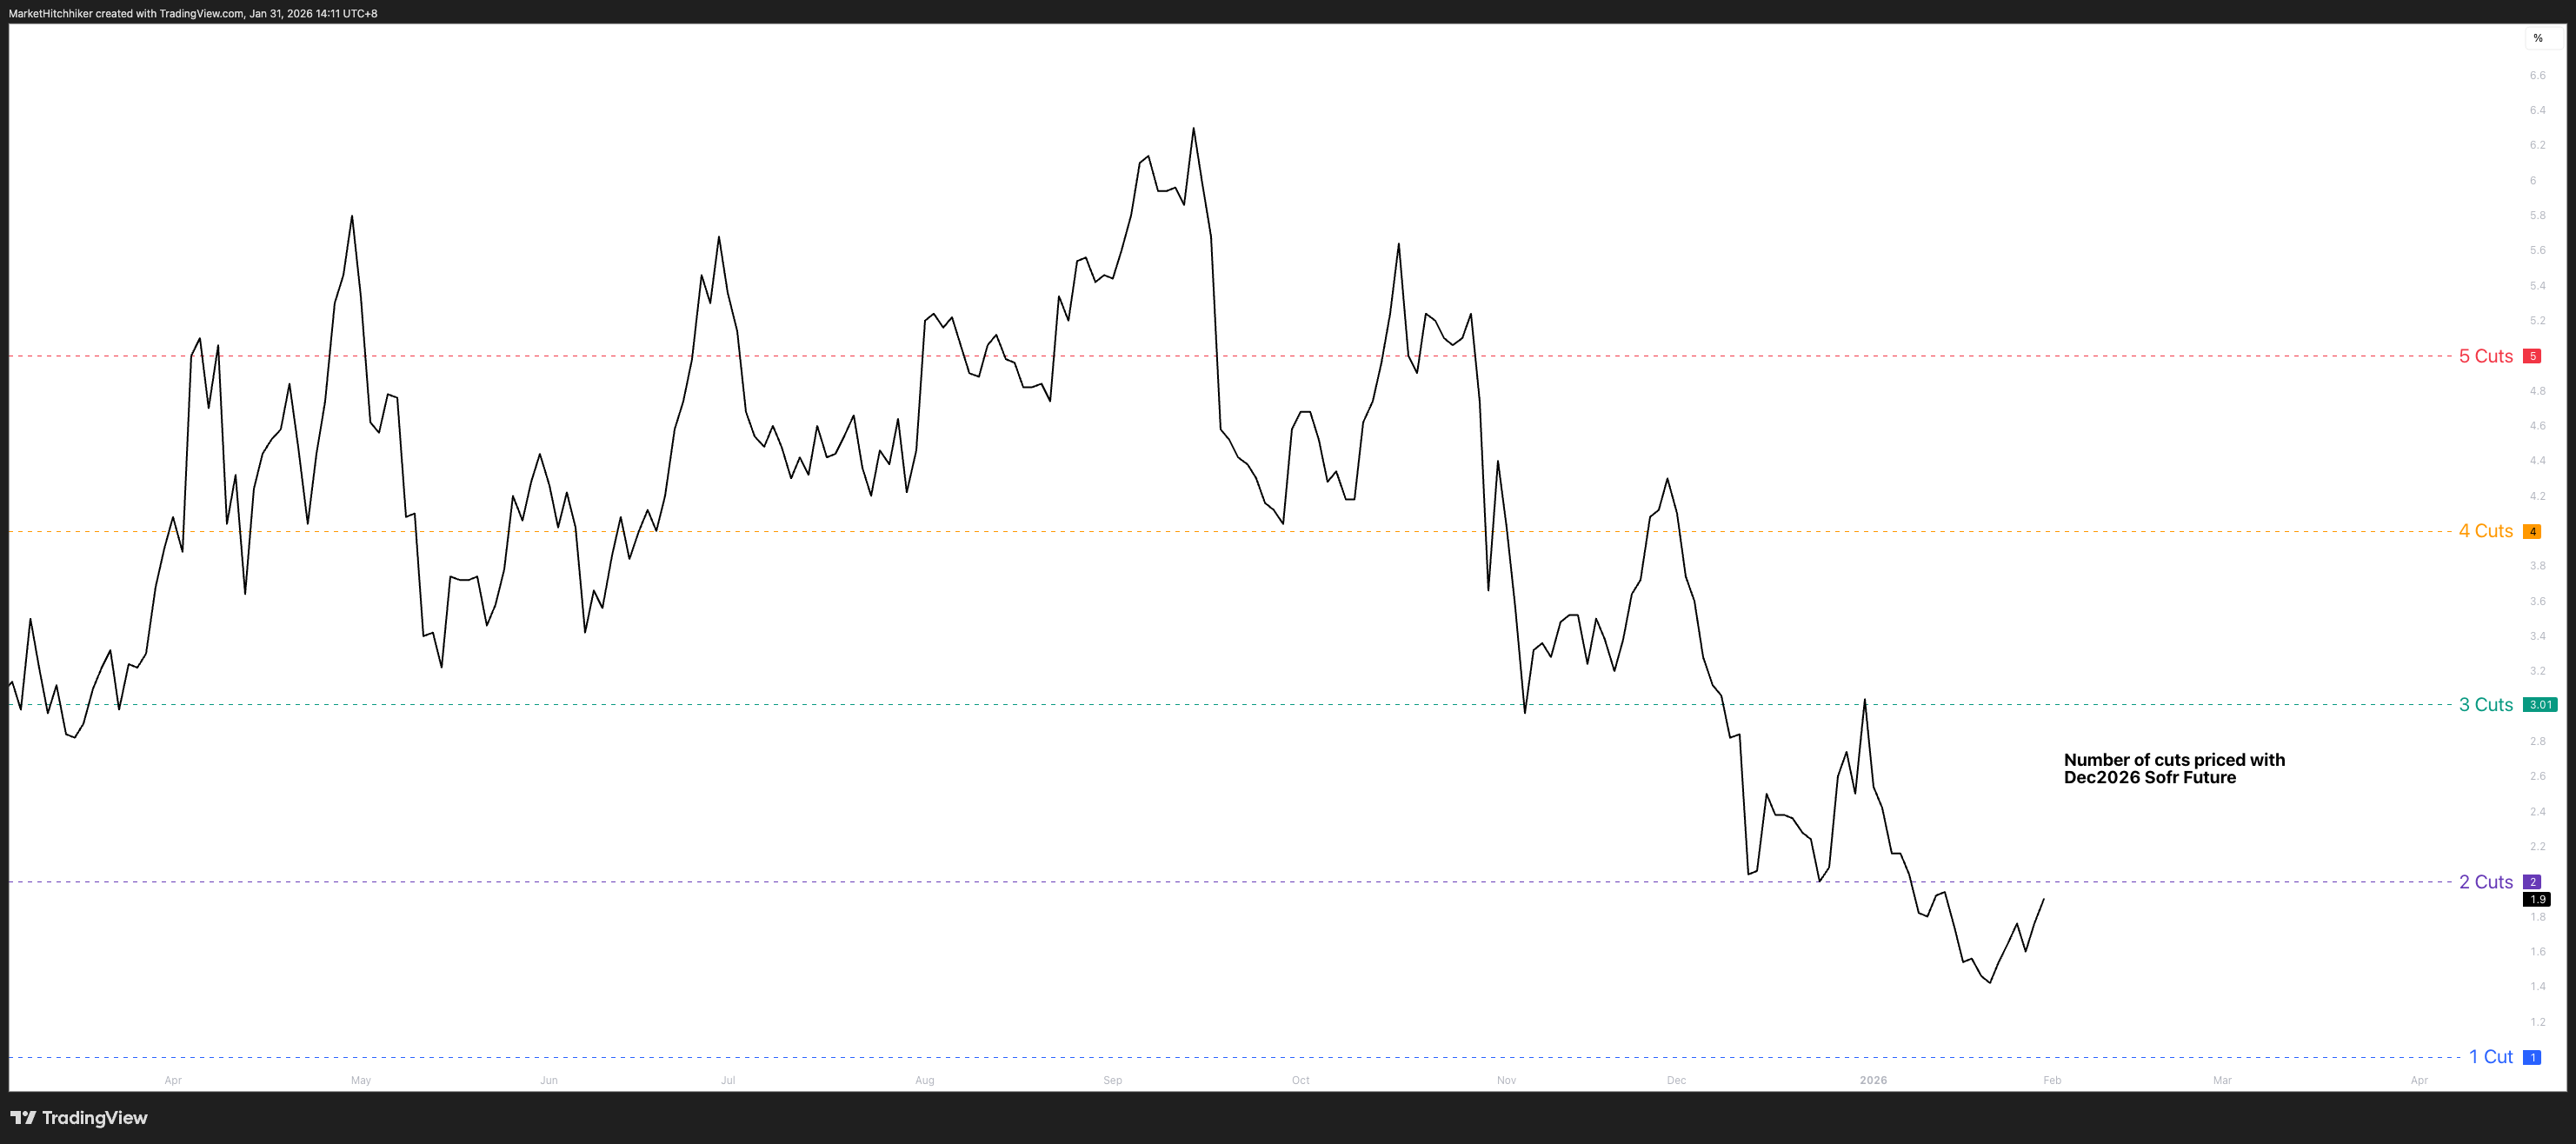
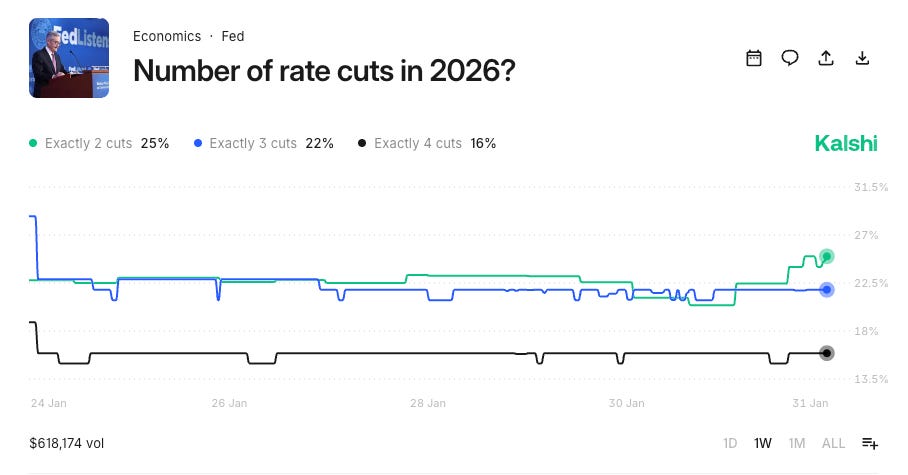
The chart below focuses solely on the number of cuts priced by the SOFR Dec 2026 contract. We have been pricing out cuts since last September, and the trend is still not broken. So far, I don’t see any evidence of Warsh having any impact on the rate/cut cycle. Until we have more clarity, anyone can speculate as much as they want, but the market is not giving any strong signal in the very front end of the yield curve.
As the SOFR futures were barely moving up, the yield curve was steepening, driven by a higher U.S. 30-year yield. This is not what usually happens during a risk-off move, when money flocks into the dollar and risk-on assets get sold off. In a typical risk-off move, the back end of the yield curve goes lower as growth and inflation expectations come down. Yesterday, we saw a steepening of the yield curve led by the back end; this is effectively an increase in the bond term premium. This validates the idea that the Warsh nomination is indeed another step toward the erosion of the independence of the Fed, and it invalidates the idea that Warsh is a hawk.
The Kobeissi Letter’s X account is really informative; it gives you a good idea of what the consensus is because it is mostly an AI slop account. This is a “negative alpha” account worth tracking. Remember Charles Munger’s mental model: “Invert, always invert.”

For what it’s worth, I believe Trump is 100% aware of who Kevin Warsh is, and he hand-picked him for his loyalty. There are strong ties between the Trump family and the Warsh family (especially on his wife’s side). Do not discount such close relationships in positions of power, especially during the Golden Age of Grift.
Here are a few X posts I agree with:


And please, stop—there is absolutely zero chance the Fed reduces its balance sheet. They will not manufacture a banking crisis just because Kevin Warsh decided to sound smart years ago. Let’s be serious. The real question is how Warsh will react during the next crisis. Is the Fed put much lower now? In the past, every—and I mean every—crisis has been fixed by balance sheet expansion and more financial engineering from the Fed and the US Treasury. This is not going to change anytime soon. However, I am open to the idea that the market will test the new Fed Chairman at the next FOMC or at the first sign of any market stress.


People were quick to link the Fed nomination news to the meltdown in precious metals. This is ridiculous. The speculation has been coming from the East, especially from Mainland China. Pardon my French, but I don’t think Mrs. Wang gives a flying fuck about who the new Fed Chairman is.

Markets, or more precisely market watchers, are always looking for a good narrative to explain large moves. It’s the proverbial “narratives always follow prices, not the other way around.” People are scratching their heads about the silver move, but it probably boils down to one simple thing: too much speculation with too much leverage.
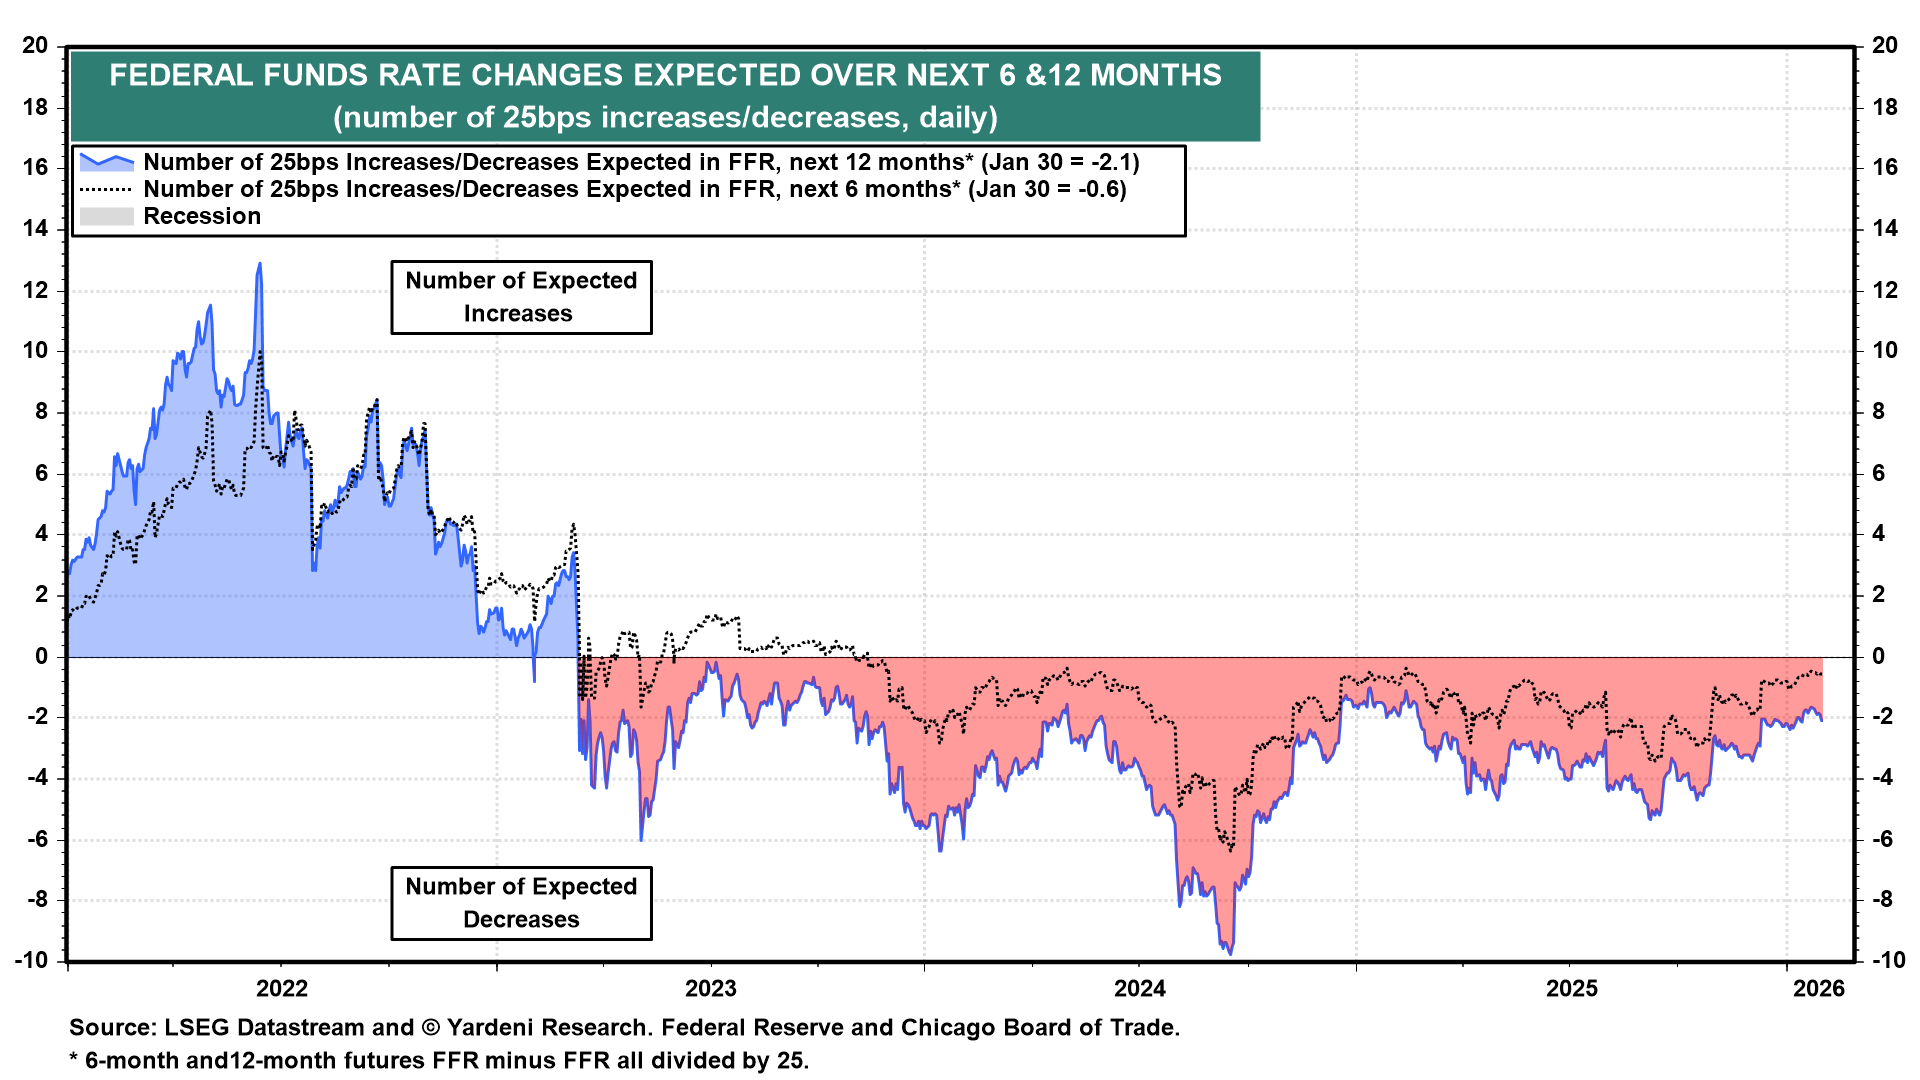
So, if we set aside the new Fed nomination and assume it won’t radically change the path forward, we can get back to analyzing where we are in the cuts cycle. As shown earlier, the market is now pricing close to two cuts for the year; this is roughly what you would expect the market to price toward the end of a cycle. There is no strong evidence to cut much further, nor strong evidence of hikes.
In their latest projection table, the Fed has been forecasting a stable unemployment rate but faster growth:
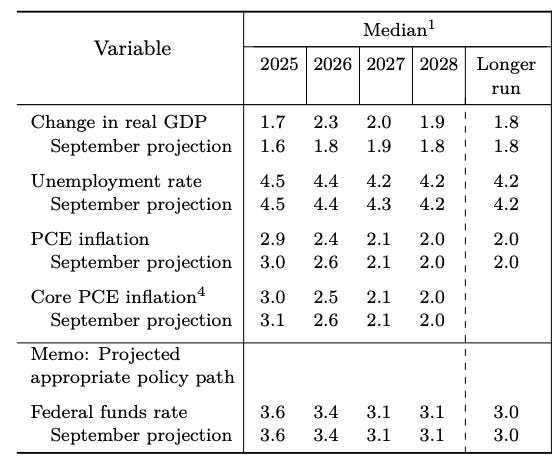
Yet, the Fed is still projecting a federal funds rate of 3.1% by 2027, while the SOFR market has been pricing 3.30%. This tells me that the Fed’s reaction function is still dovish. My reading is that the Fed is still concerned about the bottom half of the economy, a.k.a. the “lower-K.”

It doesn’t matter if the S&P 500 is at 7,000; it doesn’t matter if gold is at $5,000 (or was); it doesn’t matter if the DXY is below 100. It is not in their mandate to control asset prices (especially not to the upside).
The implication for the yield curve is rather obvious: if the Fed remains dovish around the end of the cutting cycle, naturally the steepener should keep working. However, it is at risk of switching from a bull steepener to a bear steepener given the acceleration in commodities and the Fed’s independence at risk.
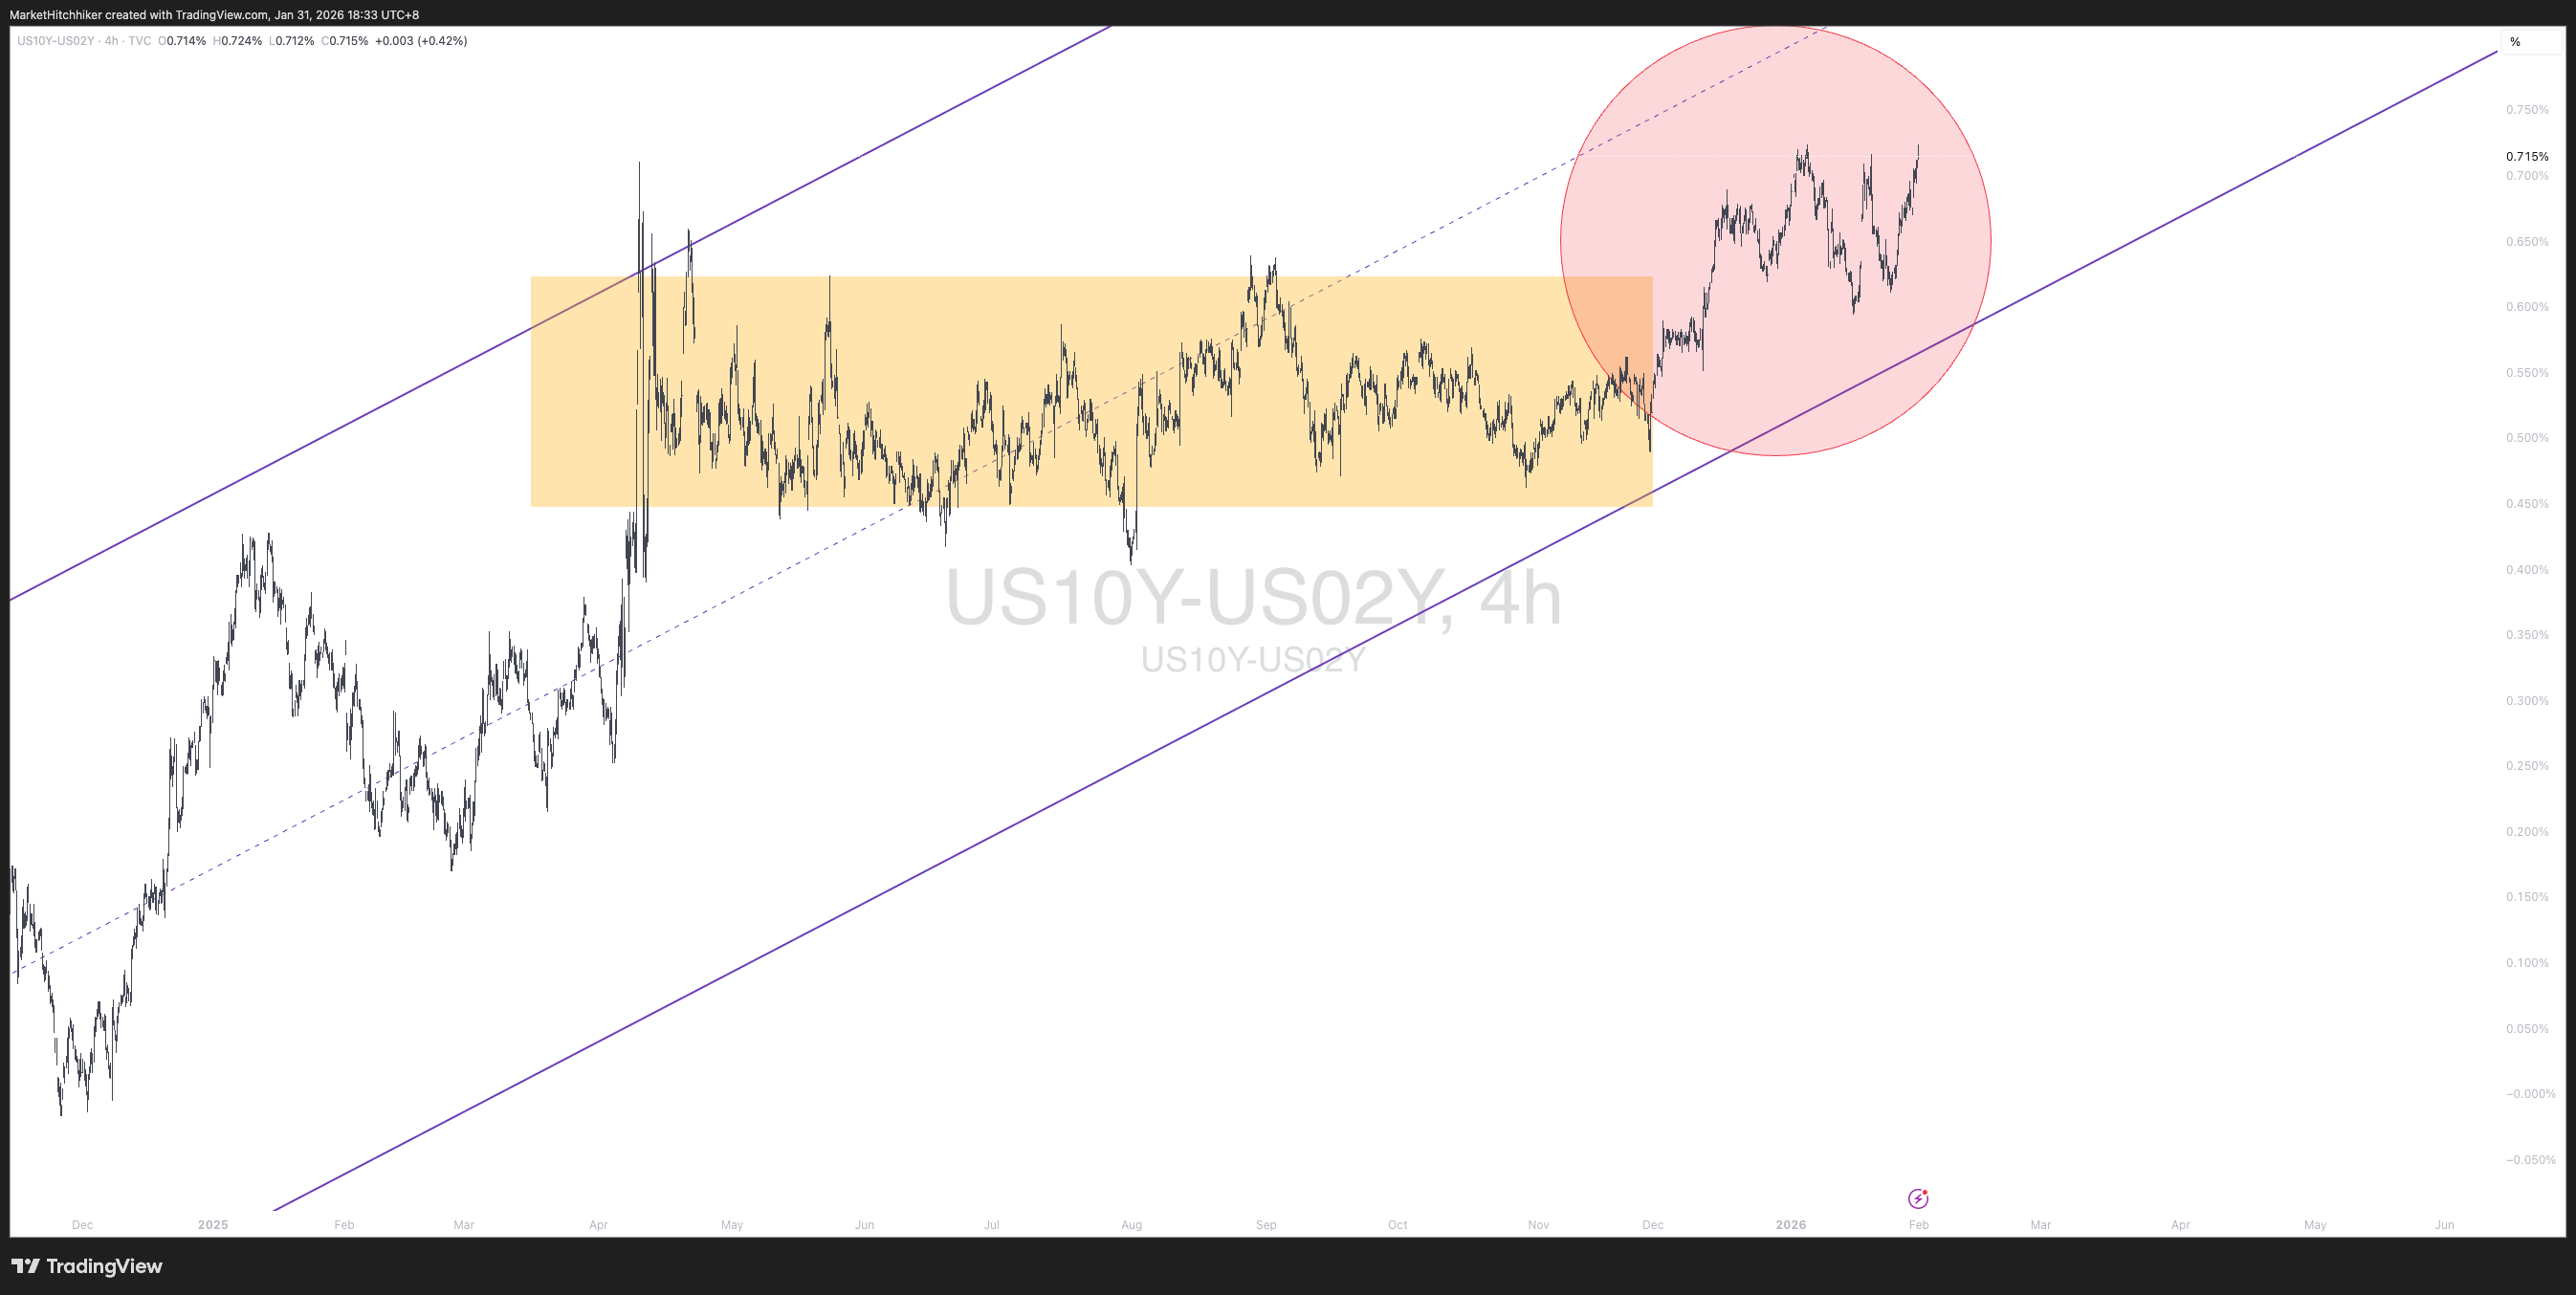
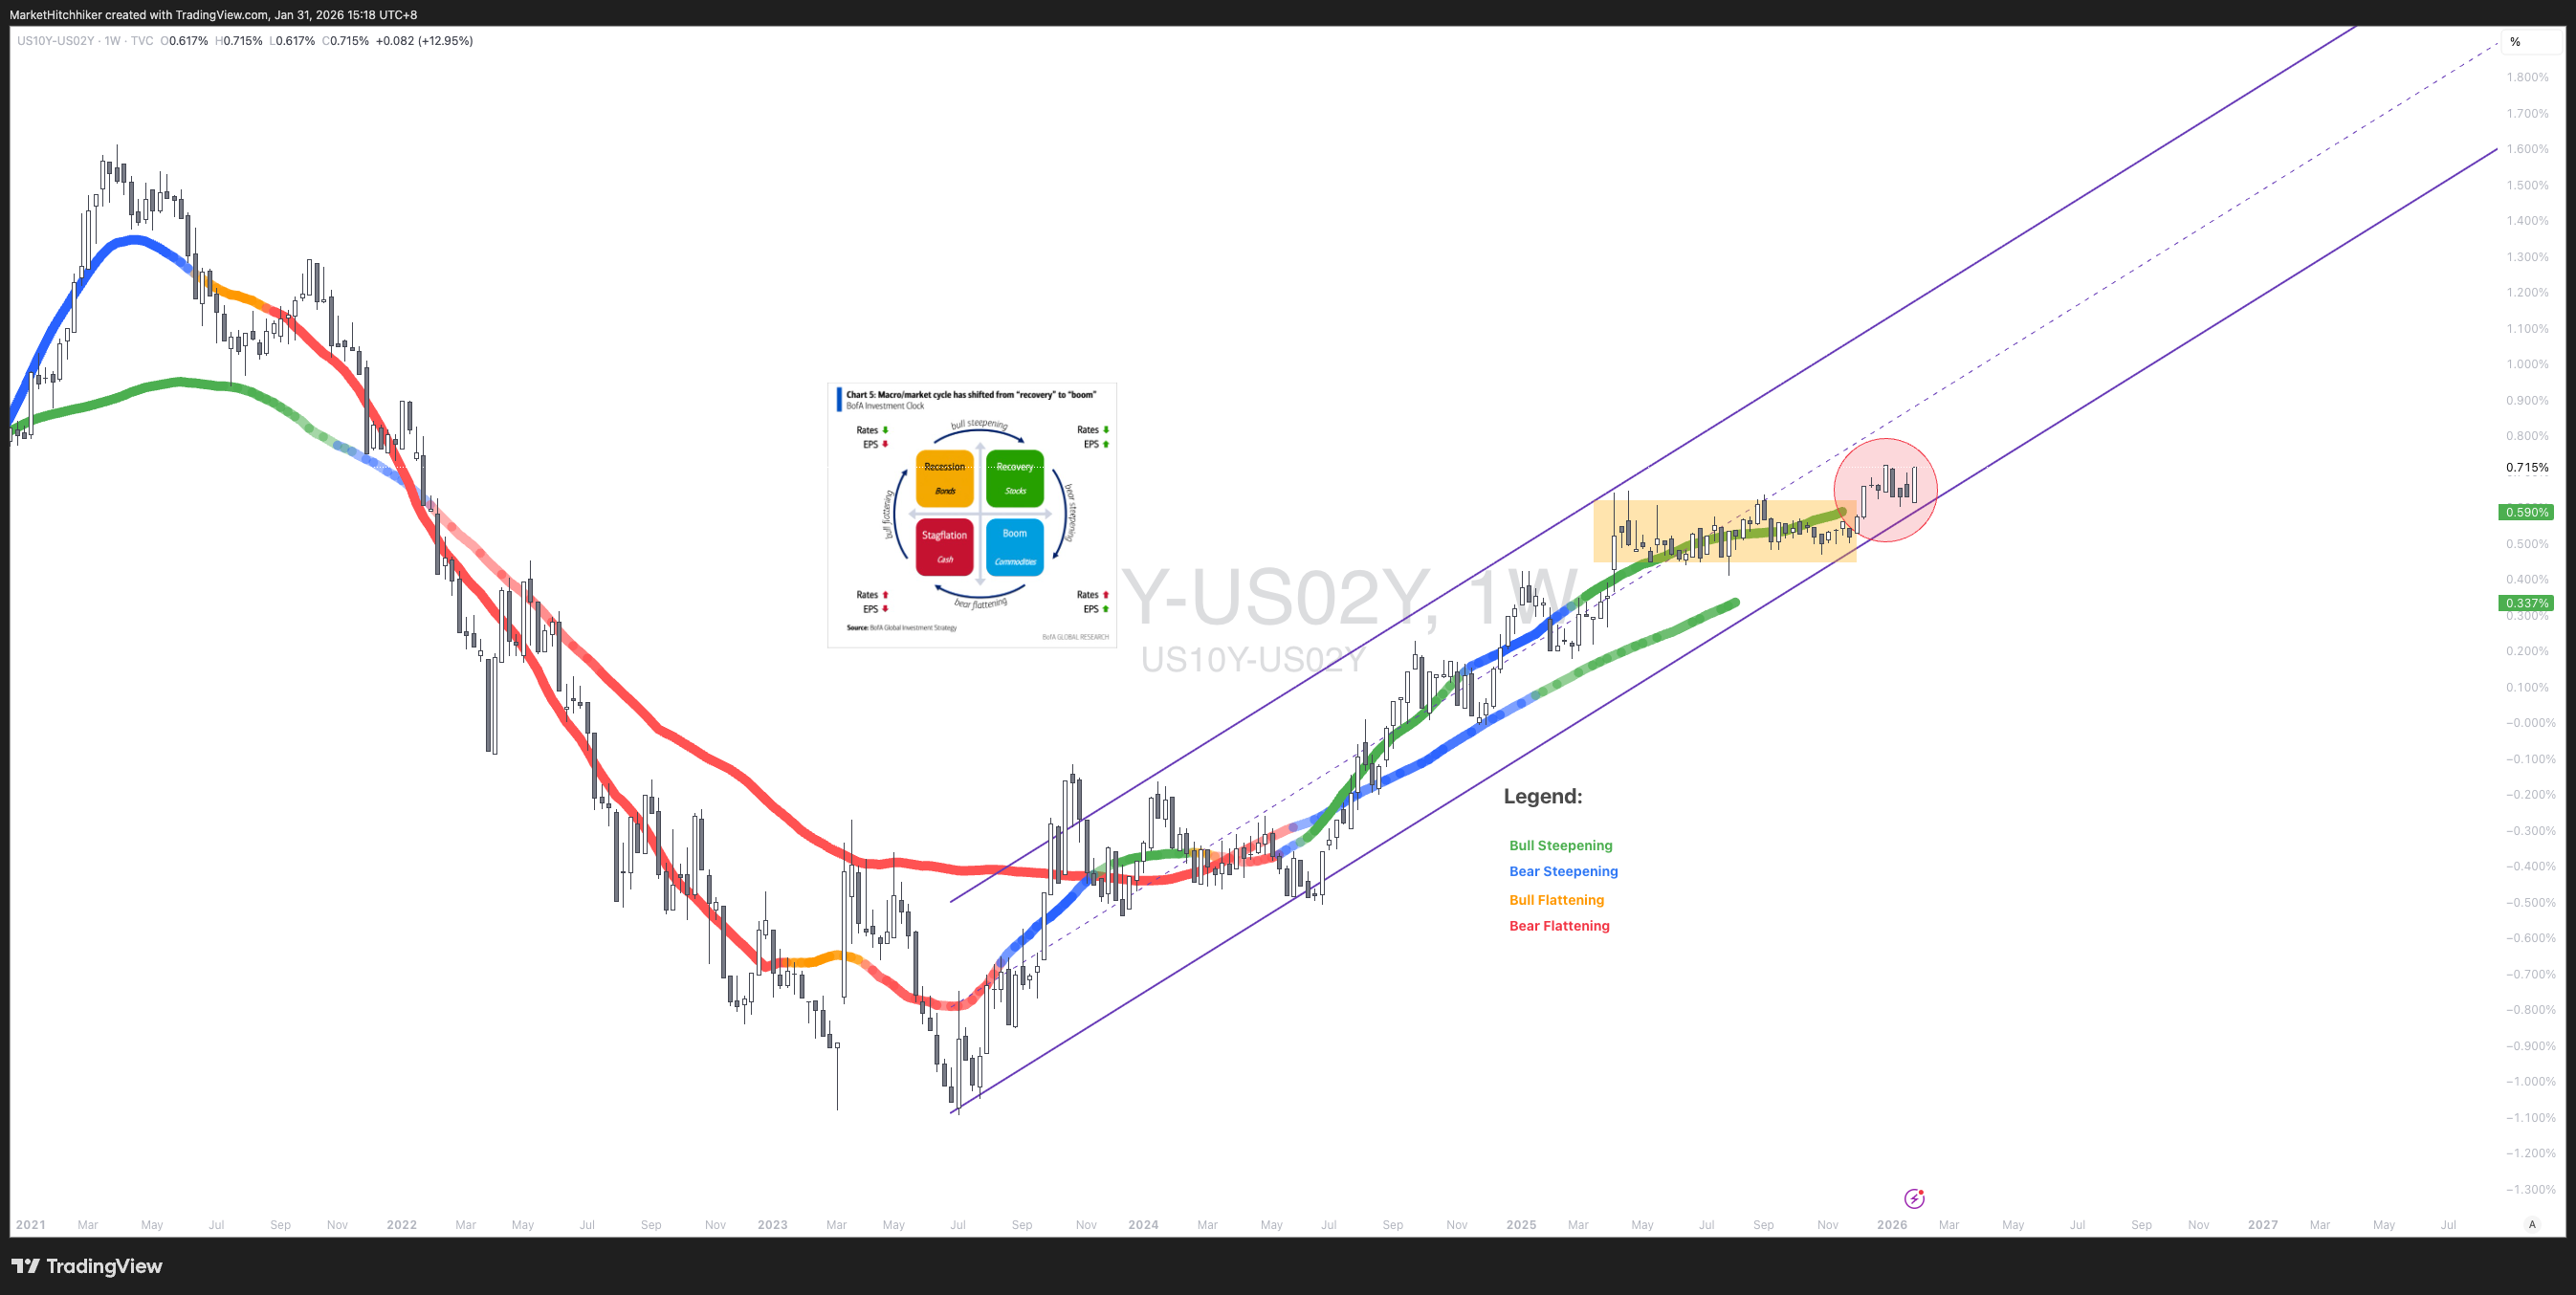
With the outlook laid out regarding inflation in Part I of this memo, and with the end of the cutting cycle on the horizon, I strongly believe the back end of the yield curve (30-year yield) is at risk. The 2s10s, as shown in the chart below, is still trending up. After a period of consolidation from April to December 2025, we are finally breaking out higher.
The mythical term premium is also rising. A simple way of approximating it is using the spread between the 30-year and 10-year yields:
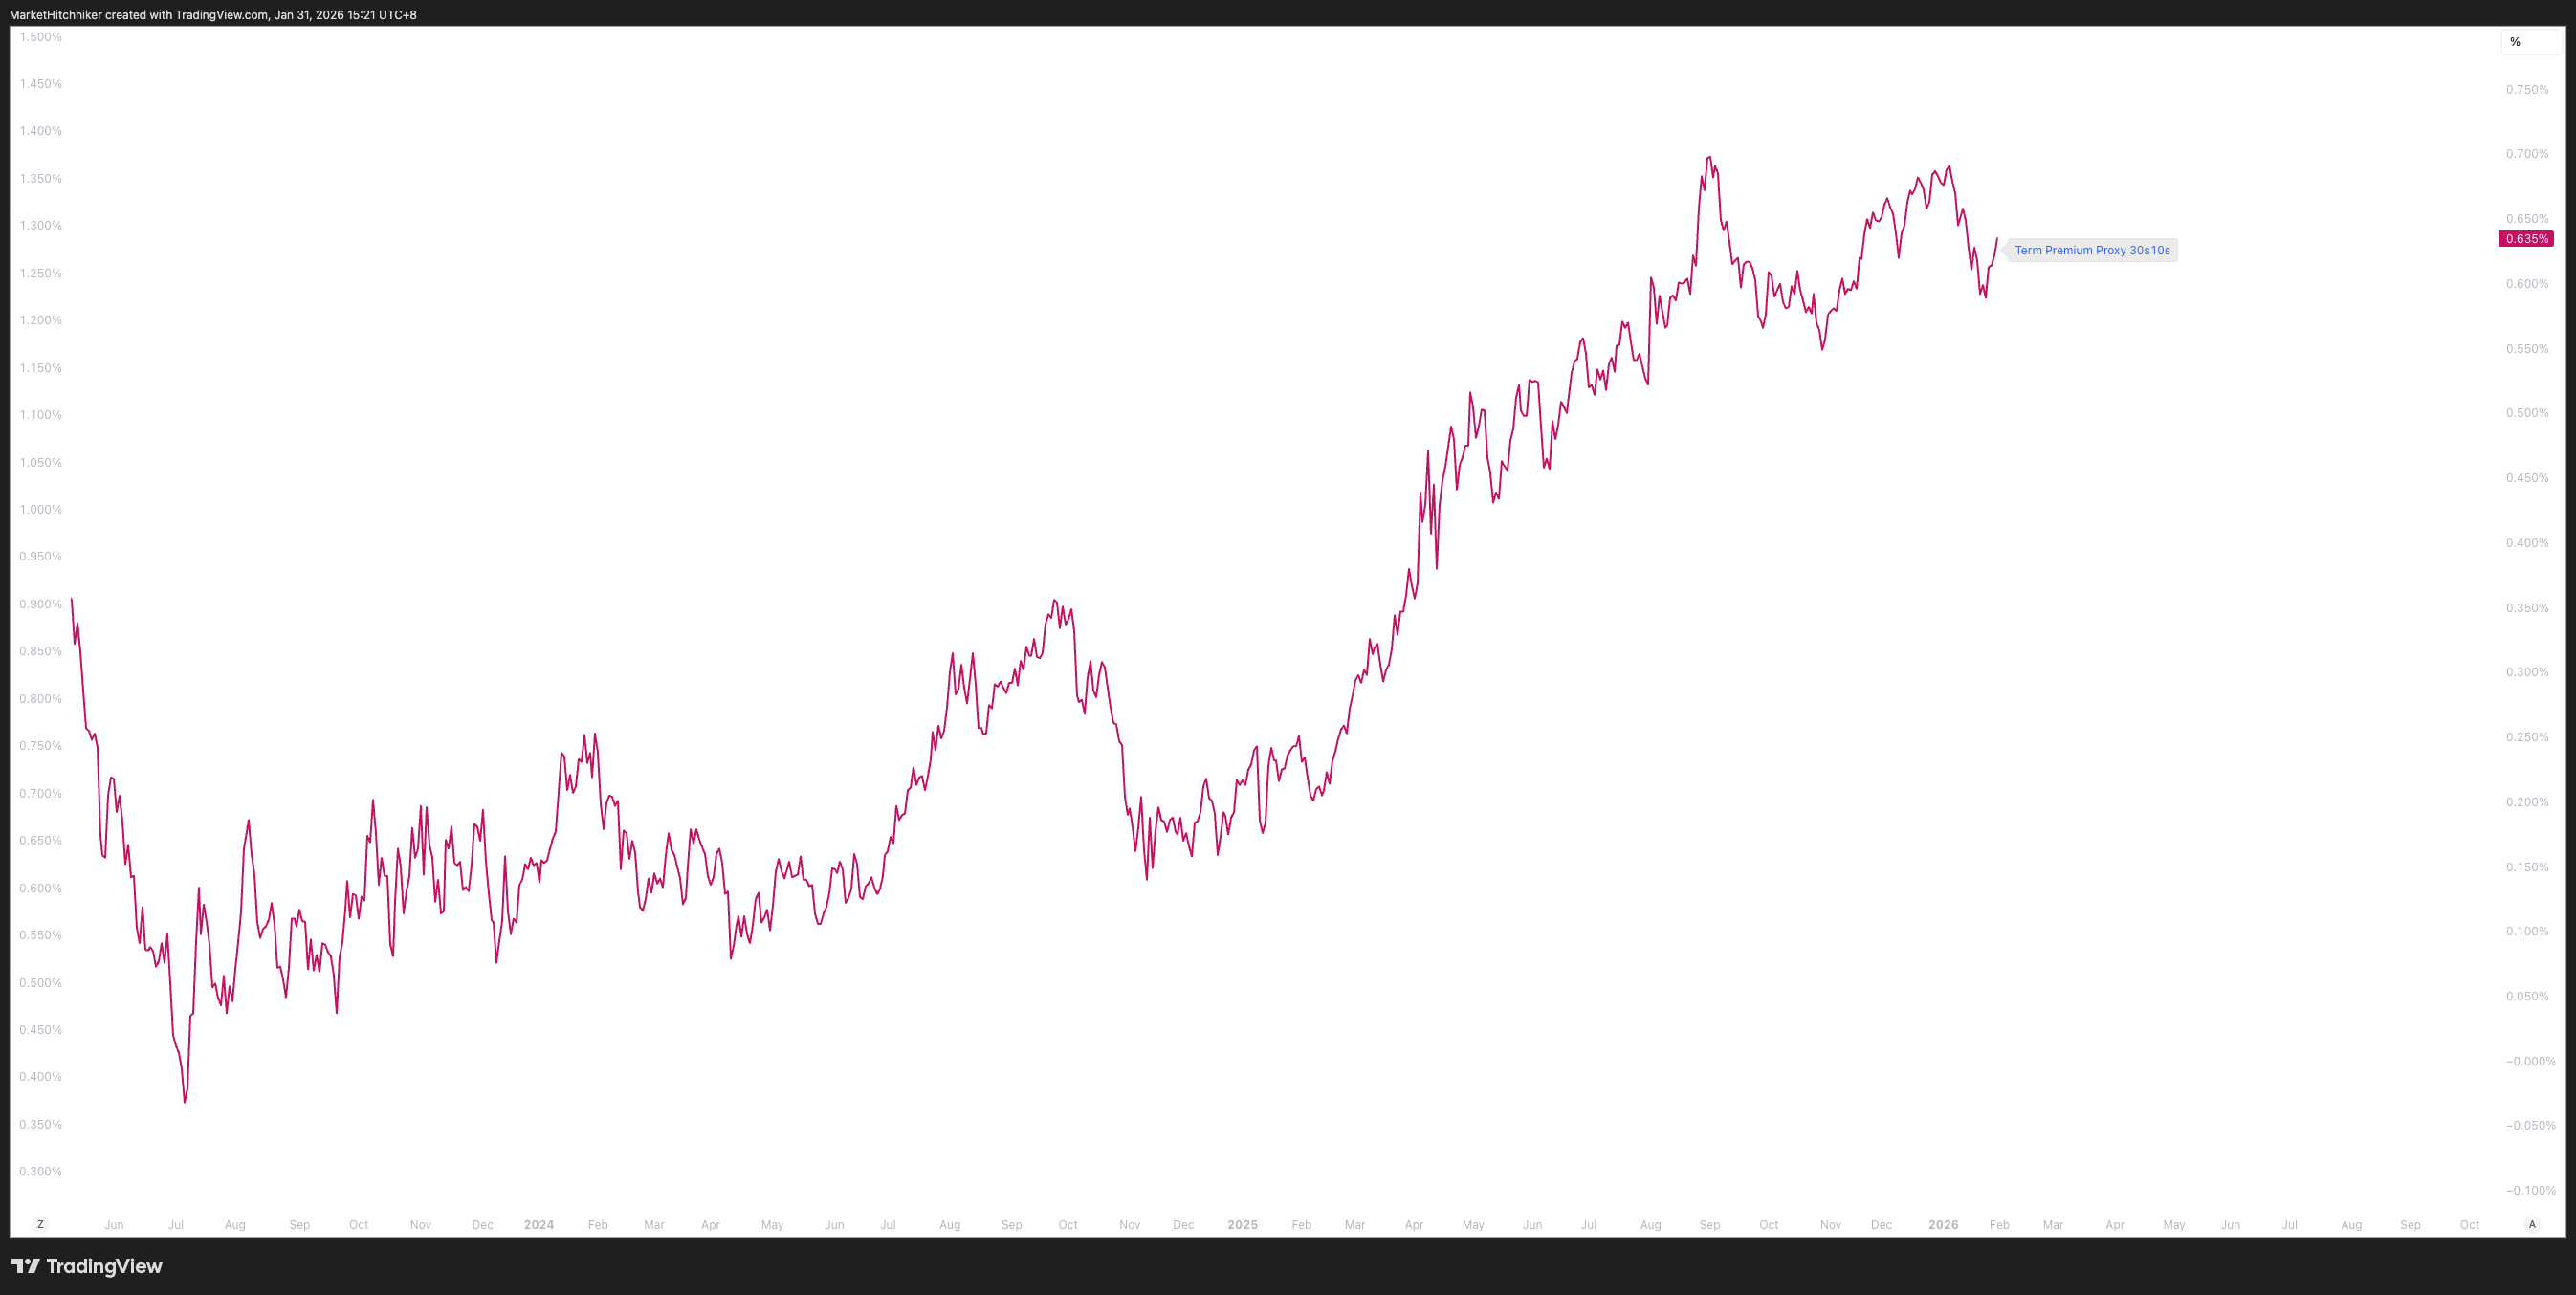
Notice how the term premium went on a tear around Liberation Day and never looked back. This is effectively the Trump premium; populism has a price.
The New York Fed offers a more robust measure of it using the ACM model:
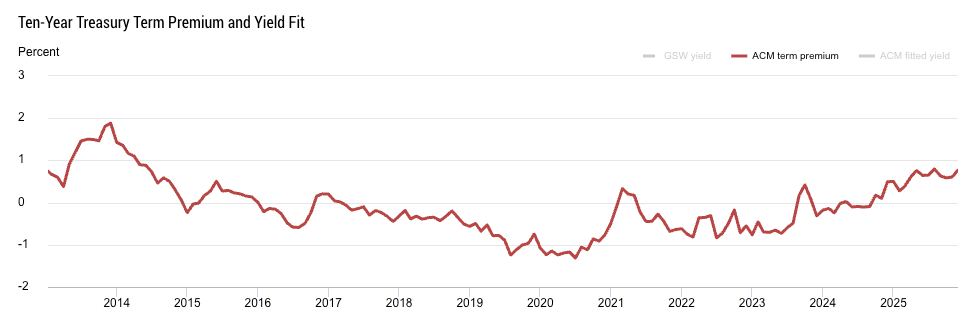
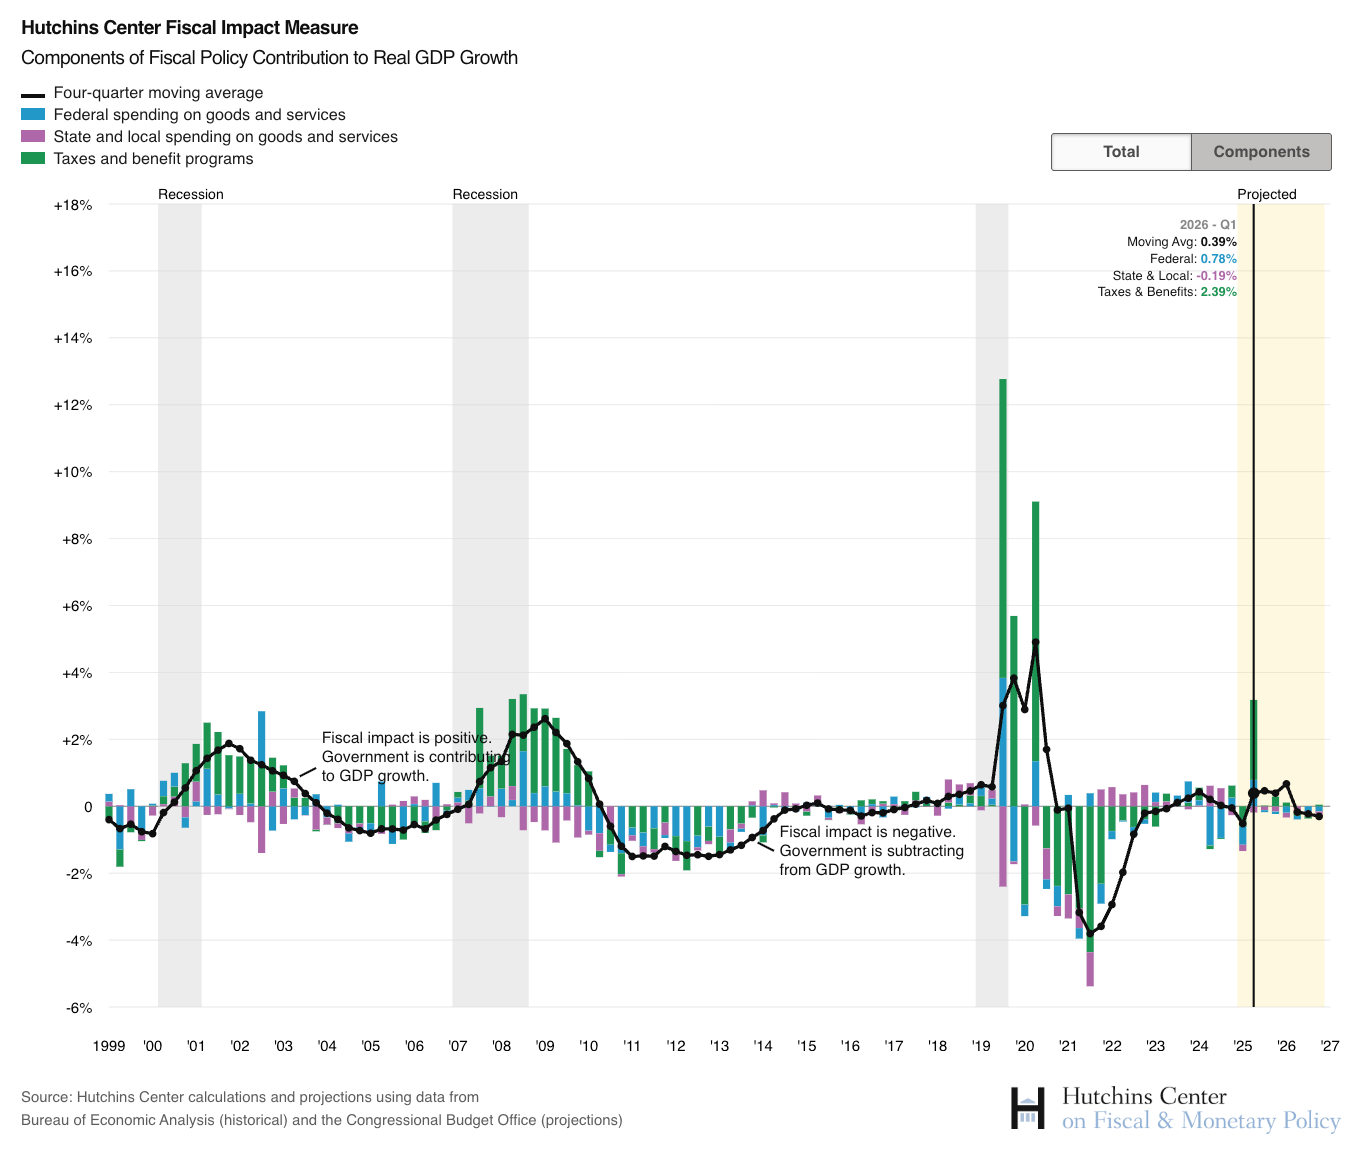
The conclusion is similar: the term premium is inevitably rising. This is a secular trend that started with the (insane) fiscal impulse in 2020, and it makes a beautiful transition to the next section.
Fiscal Policy
Unless you have been living under a rock, you are well aware of the economic regime the US is living in: fiscal dominance. Eye-watering government debt levels, high cost of debt servicing, rising inflation, high nominal growth—all these are symptoms of the same disease.
2025 is now well behind us, so let’s review some macro hard data that frames this regime.
Despite Trump’s attempts to lower the deficit, DOGE did not make a single dent in federal expenditures last year. The US Treasury comfortably spent more in 2025 than it did in 2024. You’d be a fool to think 2026 will not follow the same path, and you’d be a very optimistic person to think we will not overshoot 2025 numbers.
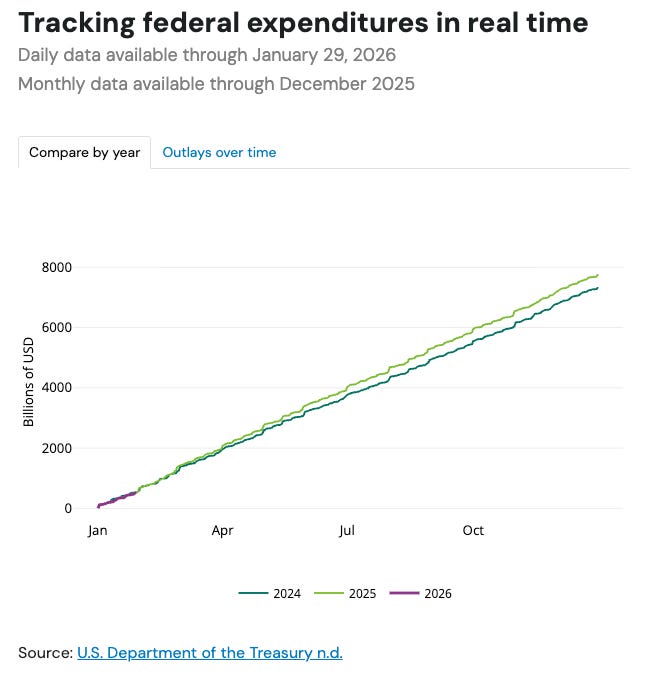
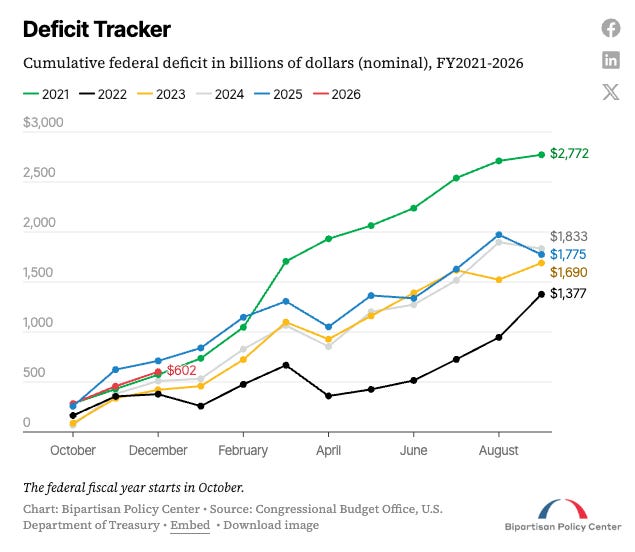
The Bipartisan Policy Center’s website has a great tool for tracking the federal deficit. Despite the increase in expenditures, the nominal deficit is closely tracking that of previous years. Receipts are growing as fast as outlays.
The report below from the same webpage breaks down the outlays and receipts. Note that the financial year starts in October, so FY 2026 is actually the number for calendar Q4 2025.
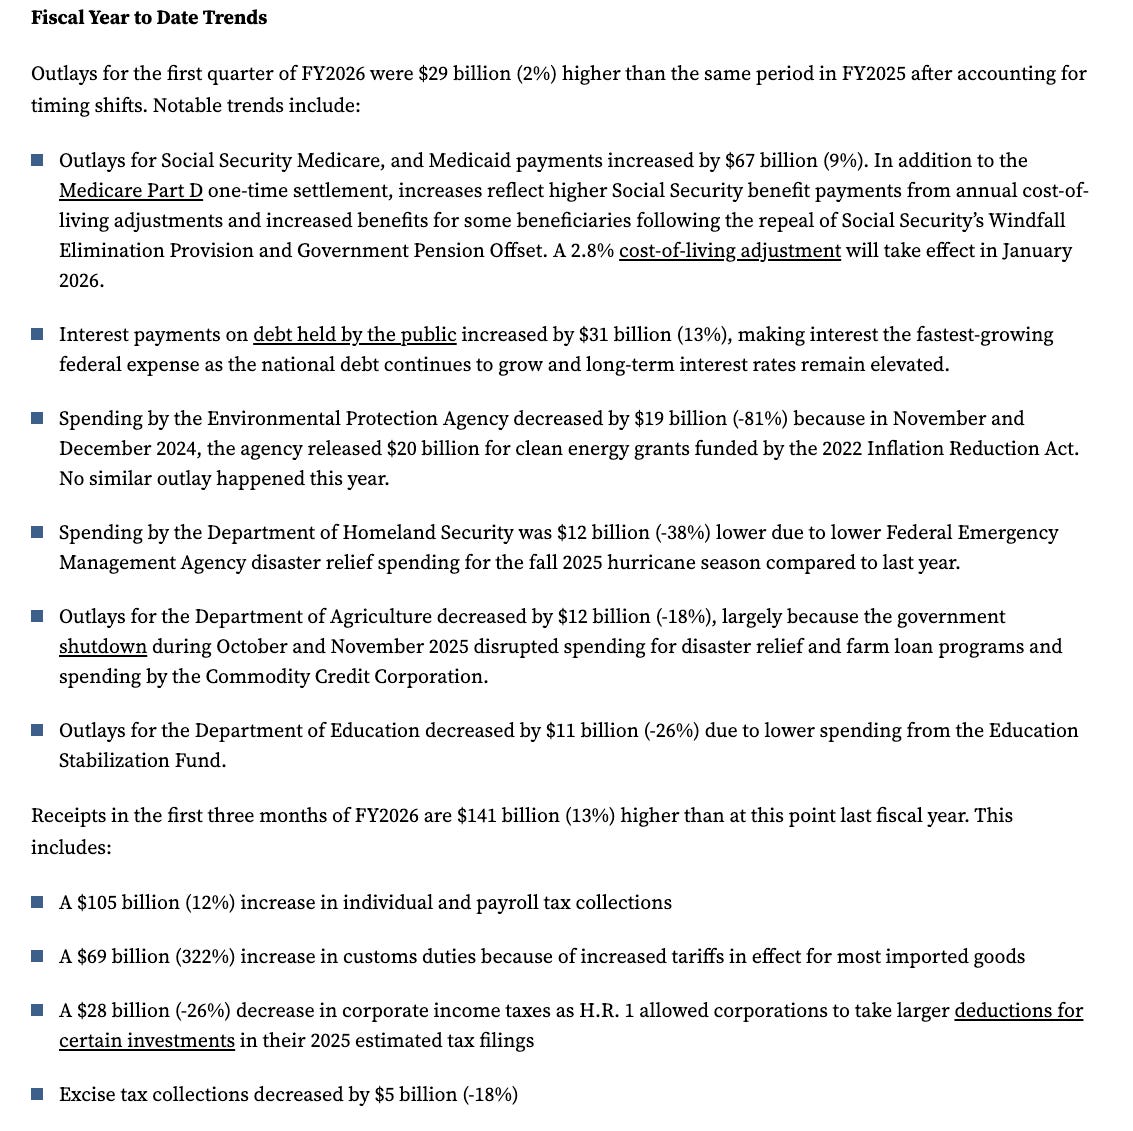
Because of the tariffs ($69 billion), the deficit actually shrank a bit compared to last year at the same time. The market shrugged it off because it is forward-looking: Q1 2026 and Q2 2026 are expected to be very stimulative for the economy.
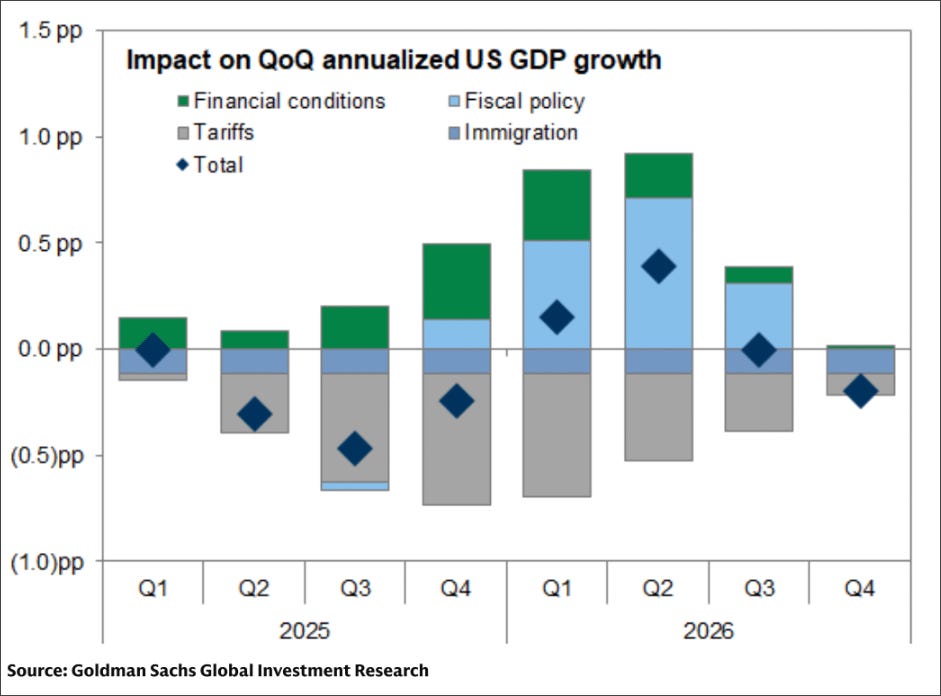
US consumers will be direct beneficiaries of this positive fiscal impulse; they are set for a strong tax refund season, with Morgan Stanley estimating that individual refunds will be about 20% higher year-over-year, boosting personal income and supporting consumption.

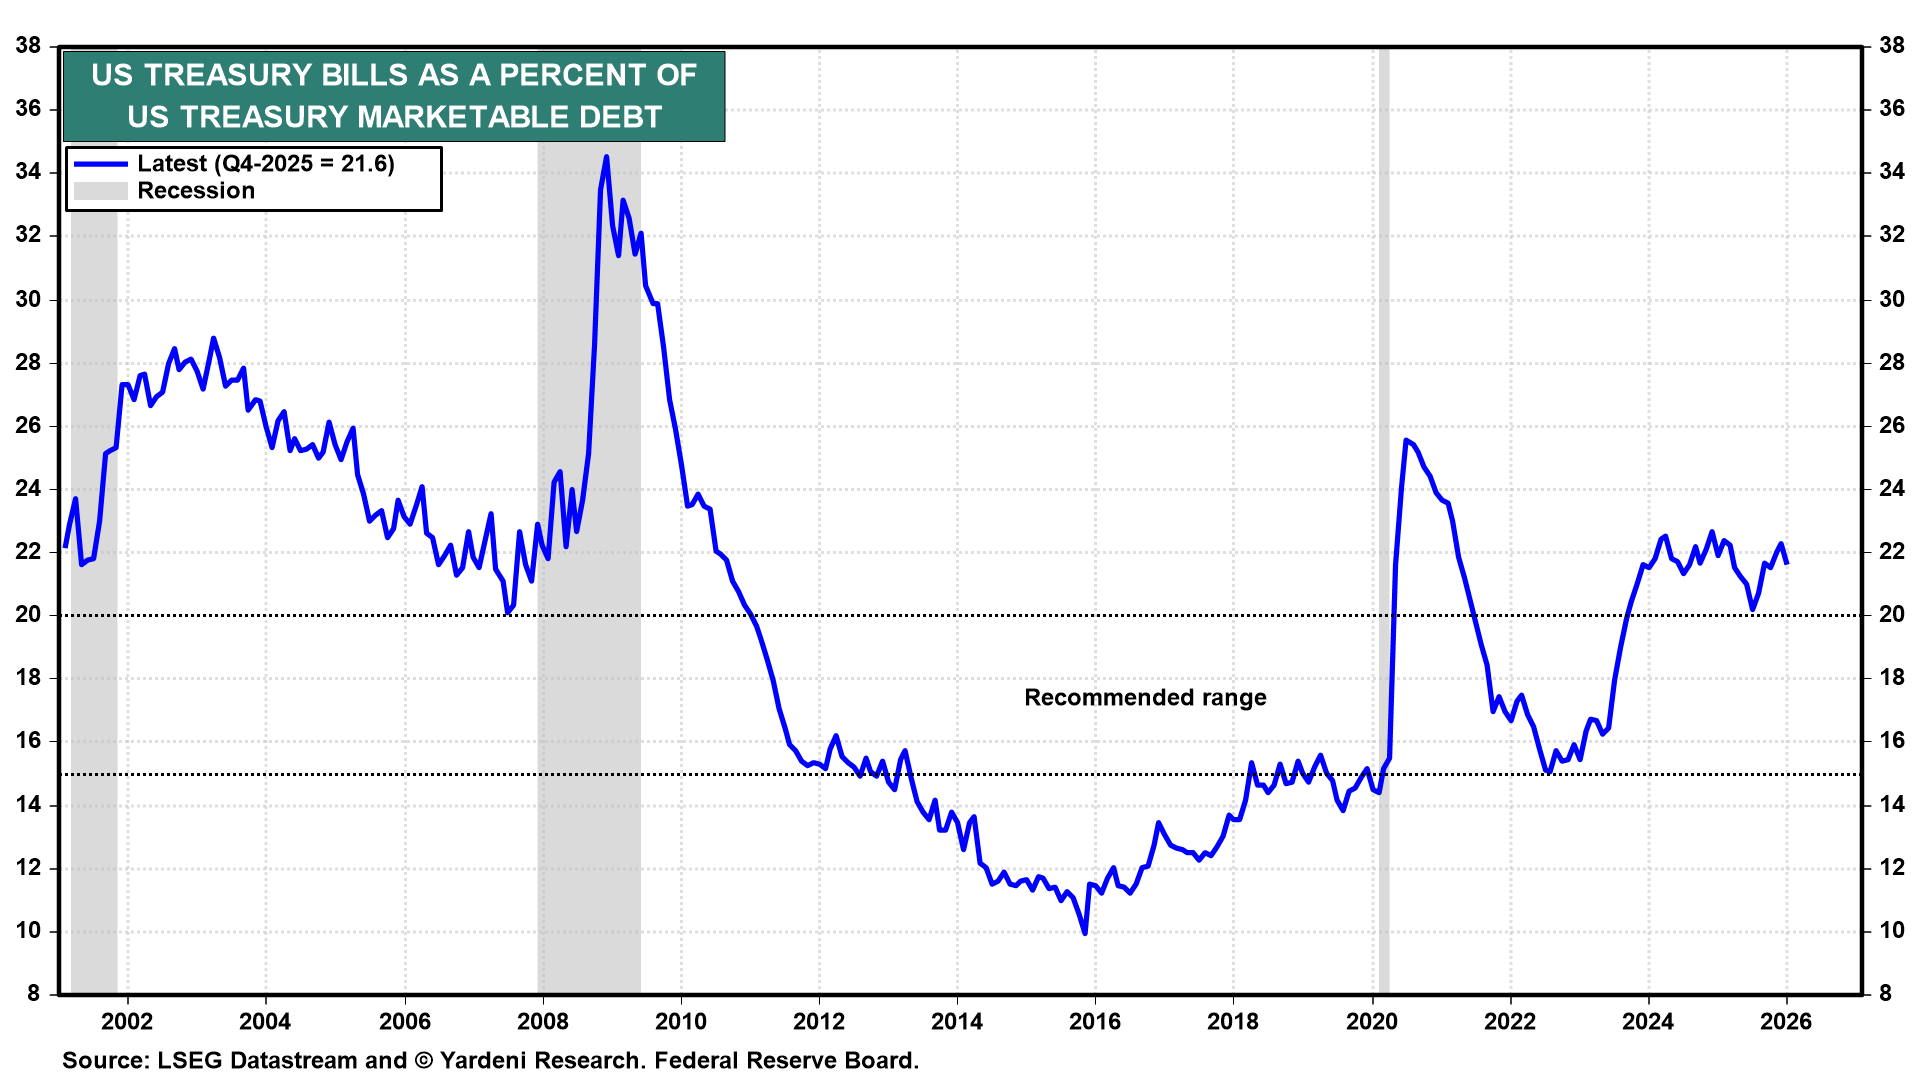
The deficit is mostly financed by short-term debt, a.k.a. U.S. Treasury bills. The amount of outstanding T-bills remains above 20% of the total outstanding debt.
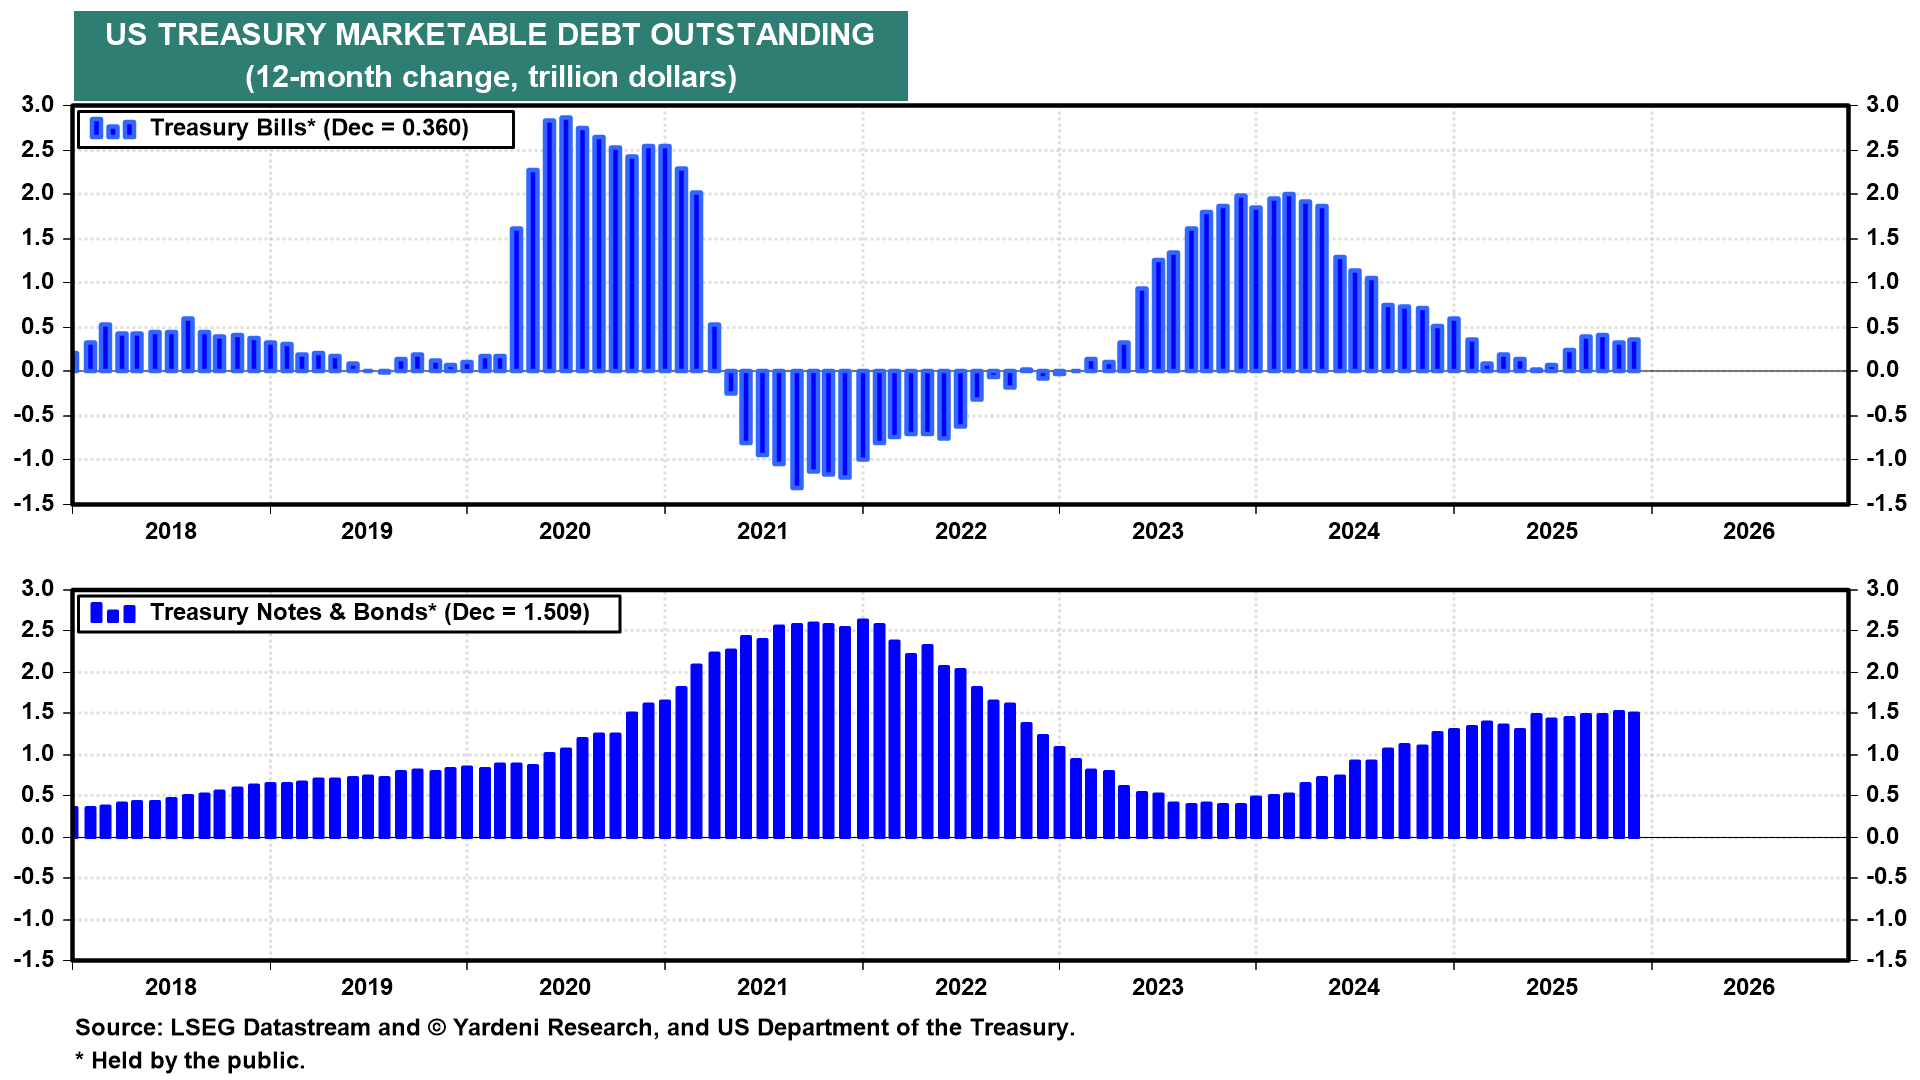
Every two years, the U.S. Treasury needs to roll these T-bills in order to refill the Treasury’s checking accounts. But as the charts above suggest, there is no sign of remodeling the portfolio’s average maturity. Bills are still increasing in nominal size; the old ones are rolled while the Treasury also issues new ones because the financing needs are still growing.
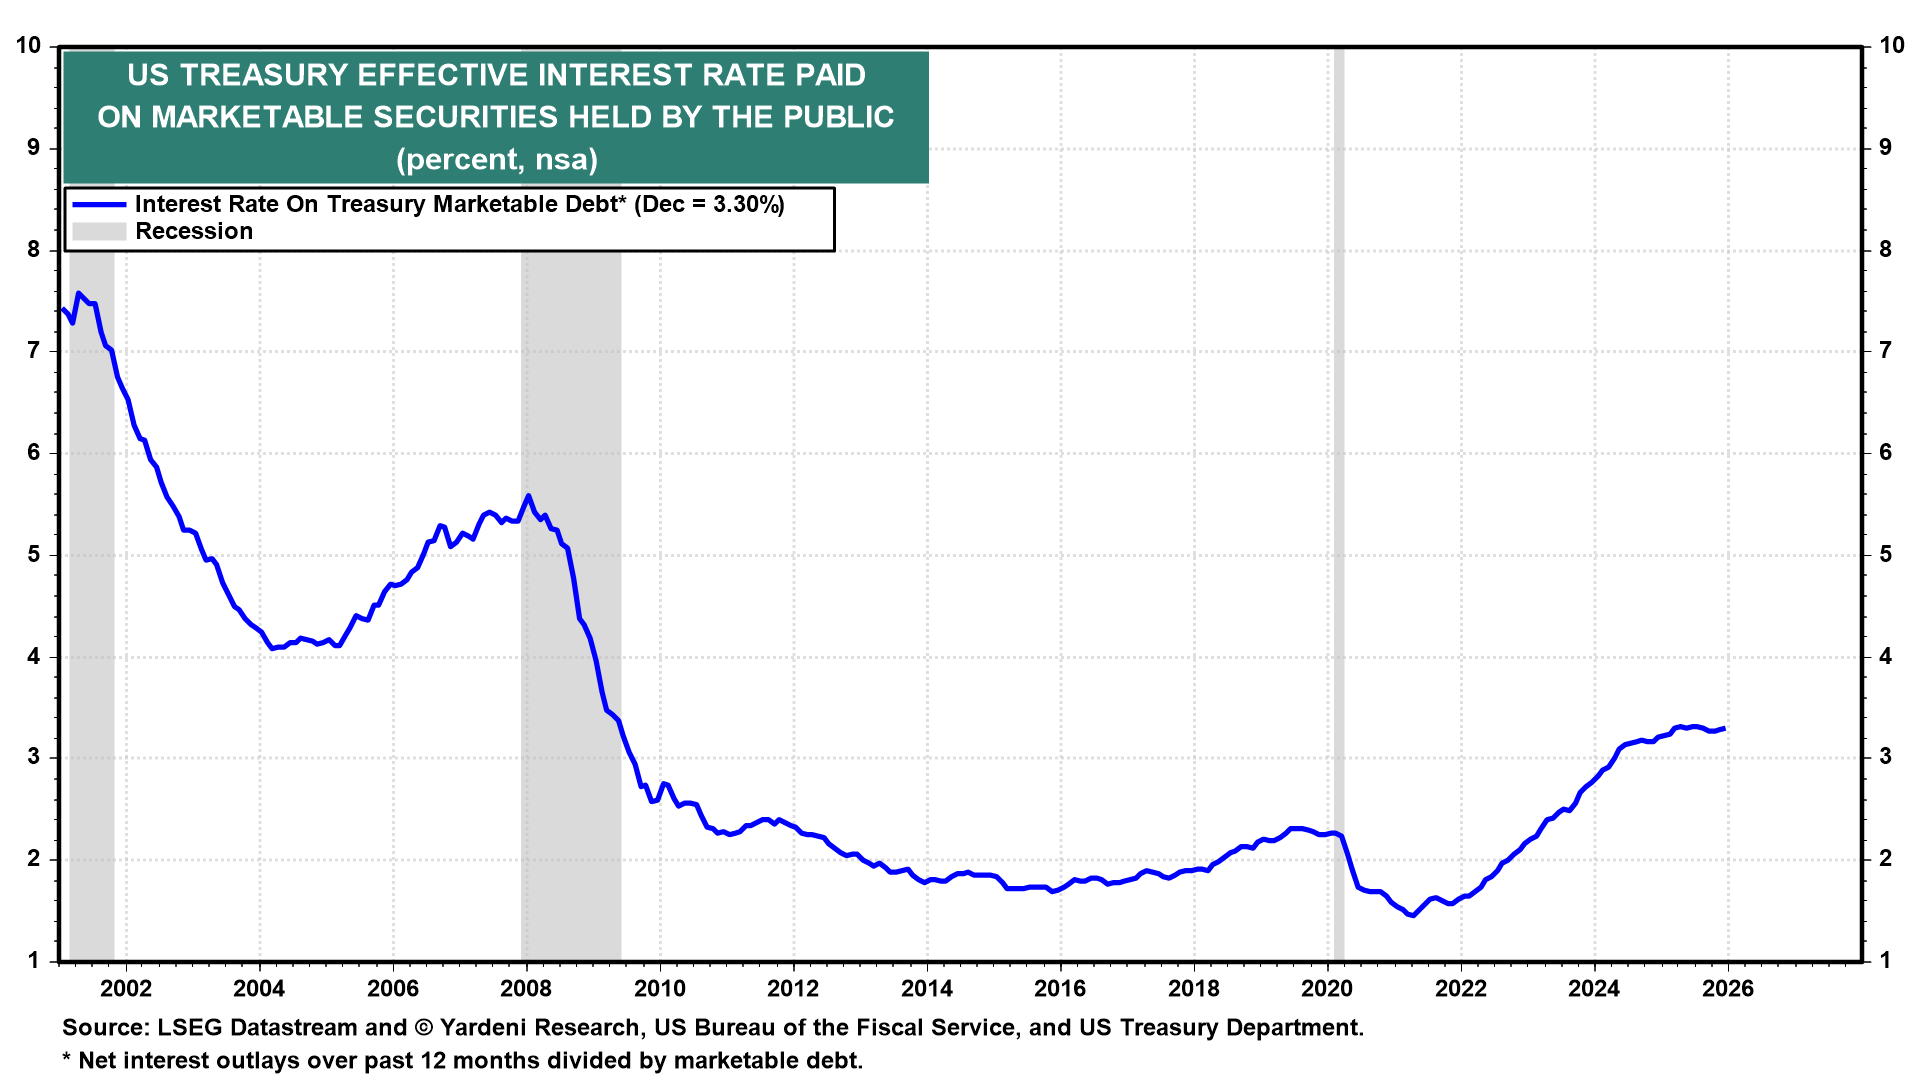
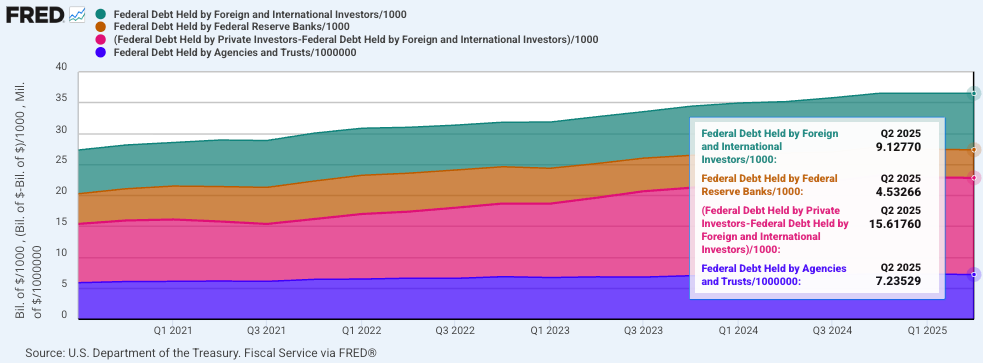
On average, the US Treasury is paying an effective interest rate of 3.30% on an ever-growing amount of debt (chart above). Around $15 trillion of the debt is owned by the US domestic public (chart below); these interest payments fall directly to the bondholders and get reinvested into the economy through consumption. 3.30% of $15 trillion is $495 billion in interest paid to private investors; this is massive. As the Treasury rolls its debt pile, the effective interest rate climbs with it as long as the market interest rate is higher. The 2-year yield is sitting at 3.50%, just 20 bps above the marketable debt interest rate. The 10-year yield is at 4.30%. The Treasury is still incentivized to roll into T-bills instead of T-notes.
Large issuance of T-bills with an inability to decrease the weighted average interest rate and the inability to increase the weighted average maturity of the Treasury portfolio is typical of fiscal dominance (and emerging markets, sadly). Remember what Bessent said a year ago: “The market and the economy have just become hooked, and we’ve become addicted to this government spending, and there’s going to be a detox period.” I’m still waiting for that detox period because I don’t see it in the data. The fiscal dominance regime is still holding true today. In such a regime, nominal growth is artificially kept high by government spending, the probability of a recession remains very low.
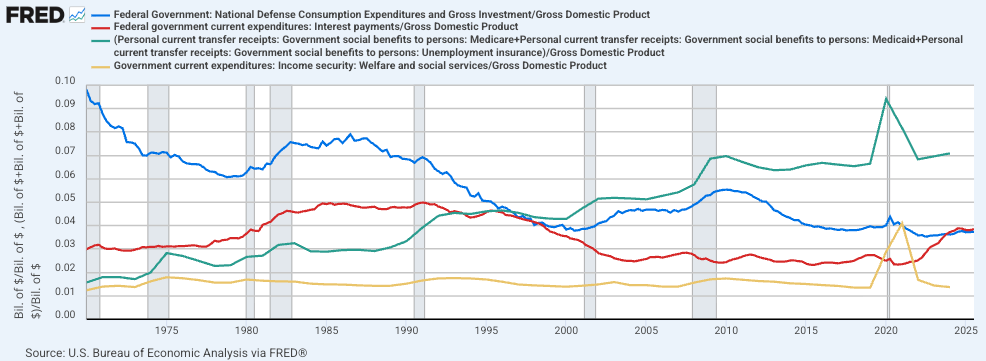
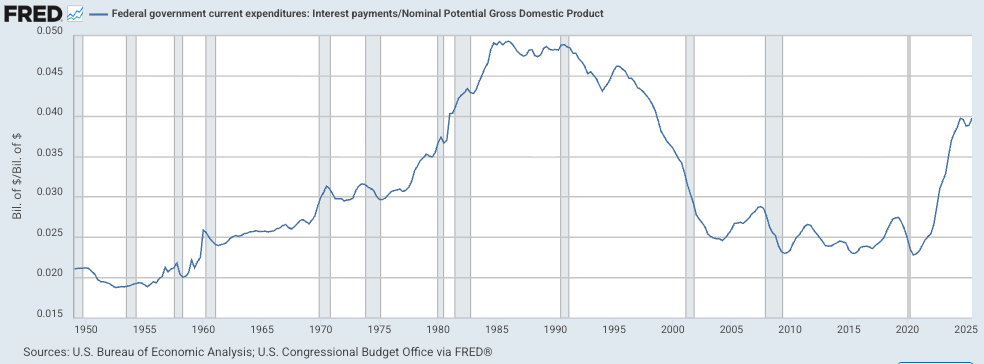
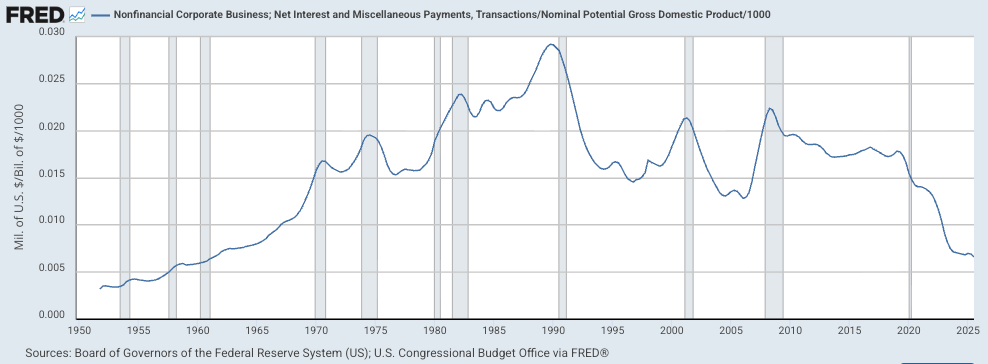
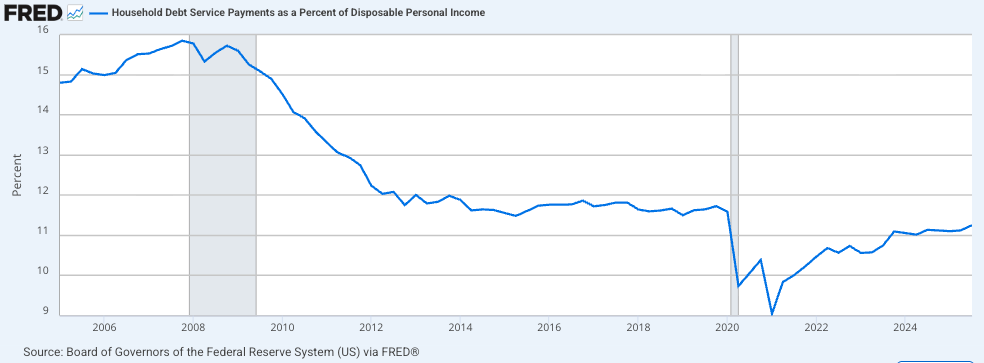
Finally, consider the three charts below, each representing the debt burden for the federal government, corporations, and households. On one side, we have a ballooning debt-to-GDP ratio for the government, while on the other side, the balance sheets of the private sector and households are extremely deleveraged and healthy. The government is cash-poor, but the private sector and households are cash-rich. Is it a bug or a feature of the system where the largest cohort of the population is now retiring? I’ll let you decide. The next crisis will not come from a credit event like 2008; instead, the steam is being let out of the system through accelerating asset price appreciation, which ultimately puts strain on societal order and leads to the rise of populism. It’s a much different playbook than what we have seen in the past 80 years.
Liquidity
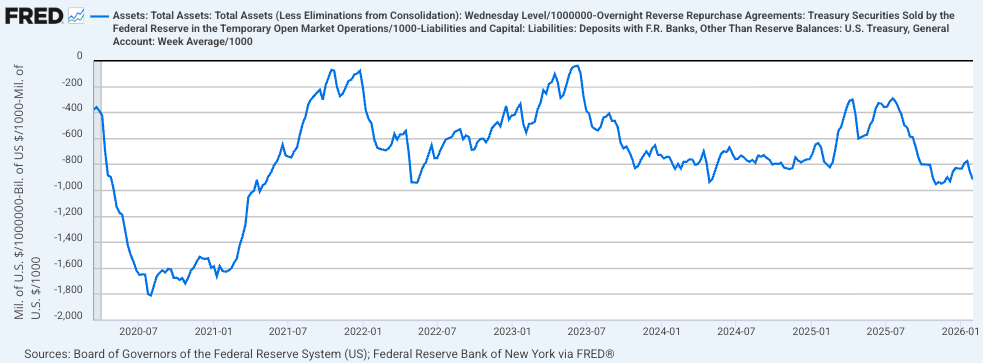
US Liquidity: The domestic liquidity index (Fed BS - TGA) remains tight. The Fed’s balance sheet has bottomed, though, and the TGA can only go one way now: lower. This liquidity metric will improve with time.
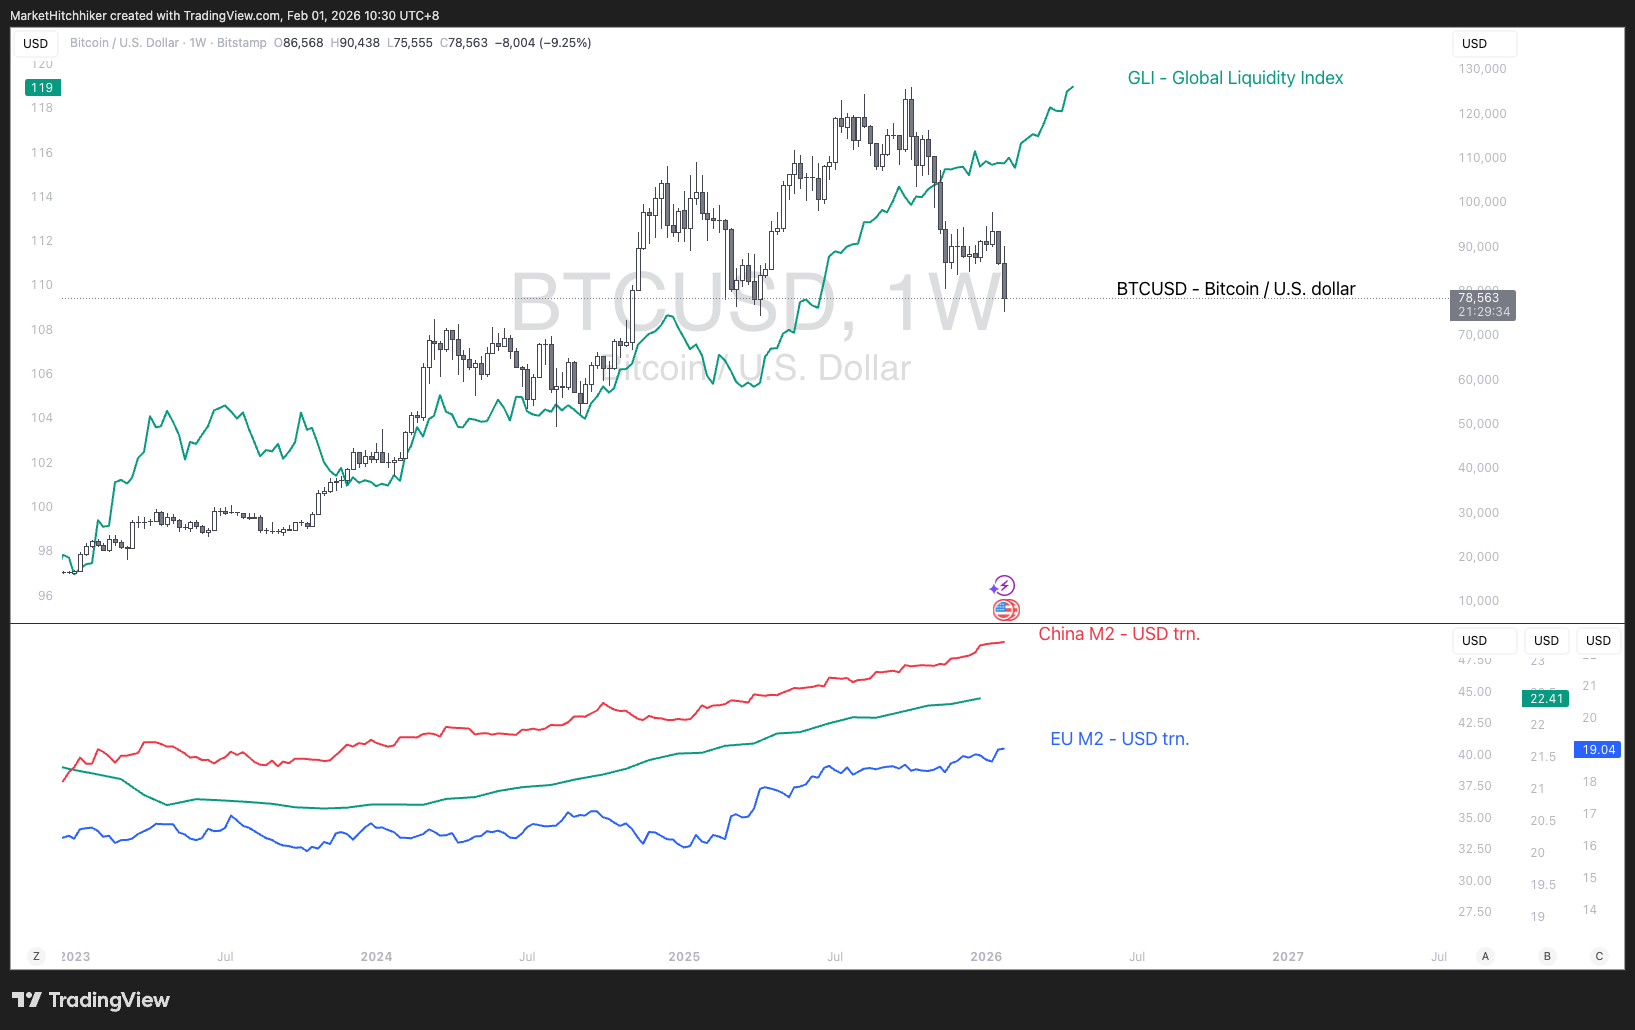
Global Liquidity: The global M2 expressed in US dollars is still shooting higher. All major central banks are steadily increasing their money supply, and the lower dollar is providing a tailwind for risk assets like gold and silver. However, Bitcoin is still decoupling from the liquidity index as it is caught in a cyclical correction and a lack of interest from speculators who are now overly focused on the boomer coins: gold and silver. Over the past few days, everyone is painfully learning that the inelasticity of supply with an elastic demand can cut both ways. With a lack of intrinsic value, price becomes extra sensitive to flows and sentiment, which can reverse in the blink of an eye. This is a cautionary tale on trading and investing in such assets.

Summary
The US economy is potentially at peak Goldilocks. The next major source of risk is a renewed rise in inflation and a transition toward an overheating economy. But we are not there yet.
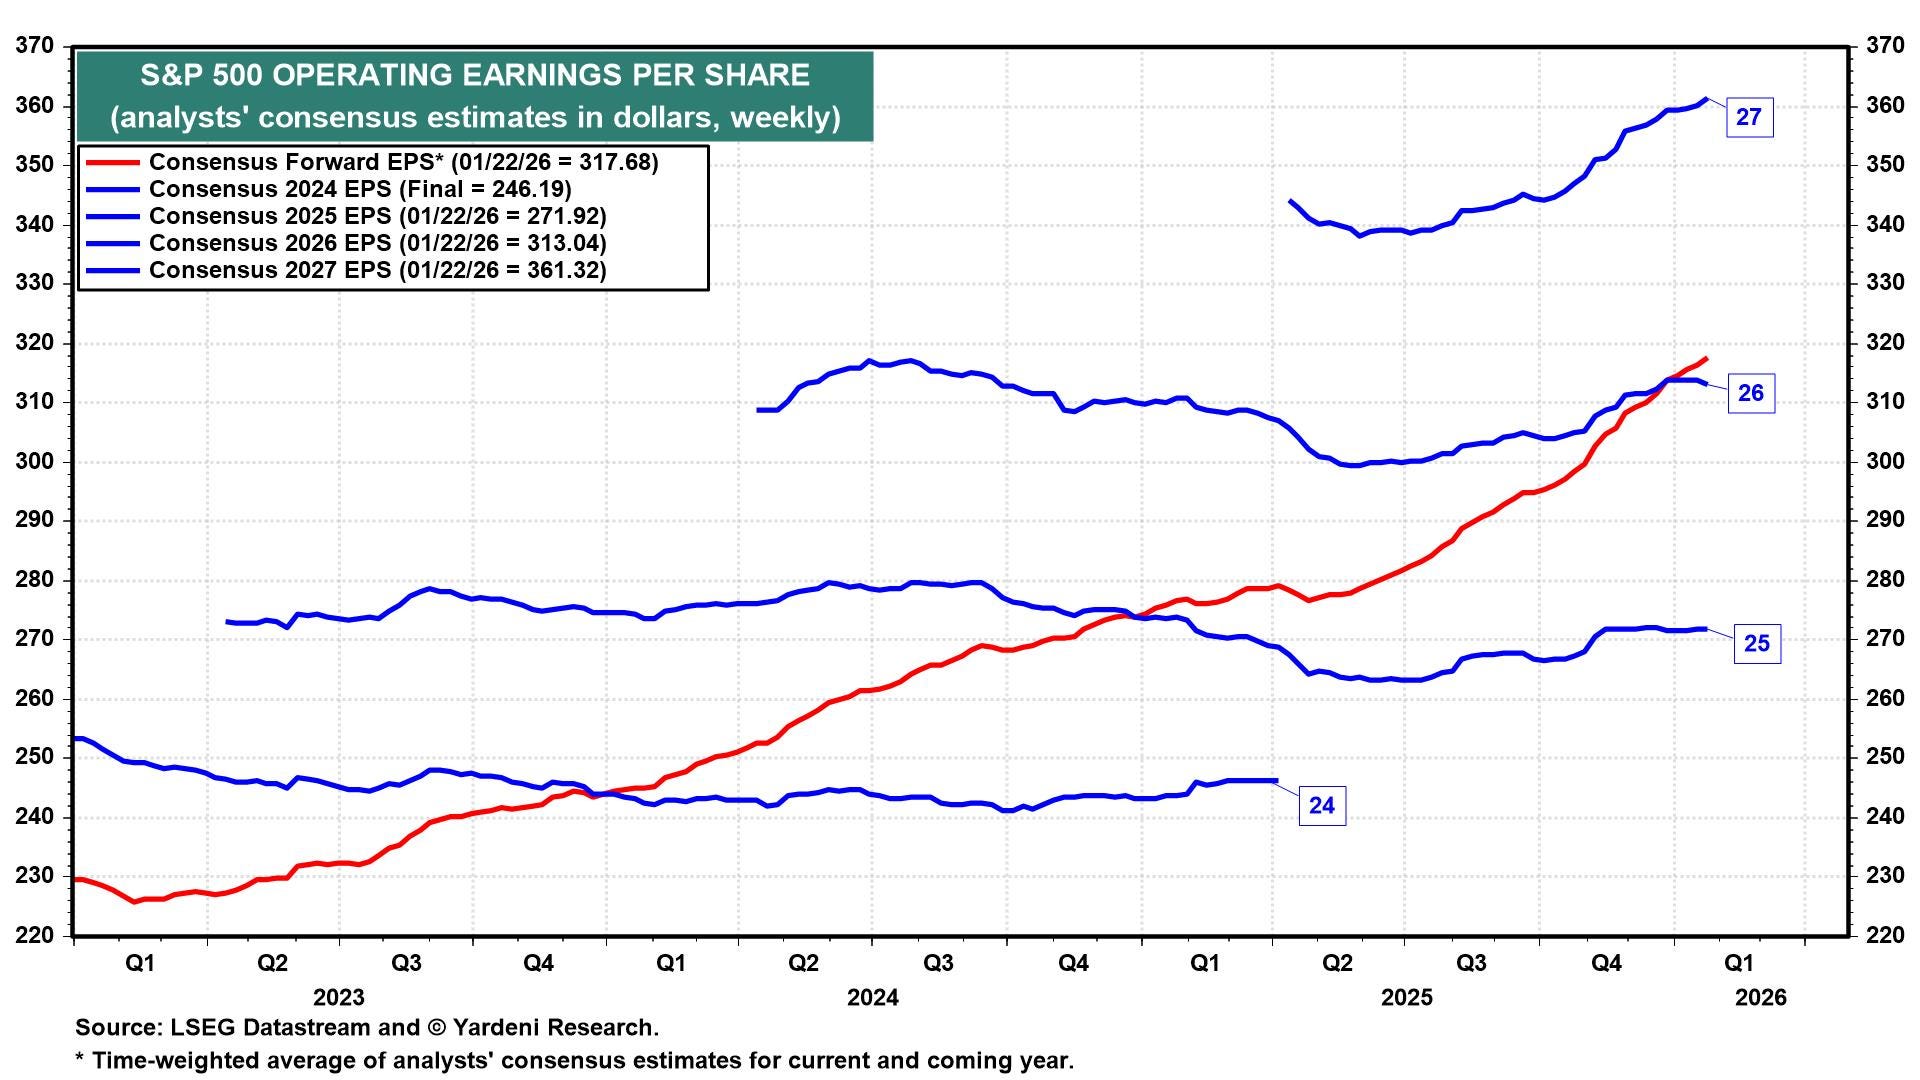
Growth has been very strong and should remain resilient. My favorite forward-looking indicator is the S&P 500 EPS next-twelve-months (NTM) estimate. It continues to trend higher as US companies keep delivering earnings growth through a combination of rising sales and expanding margins. The sky seems to be the limit here.
Is this too optimistic? I don’t think so. Historically, one should be wary when analysts aggressively revise NTM EPS sharply upward in a short period. That has not been the case recently: the past quarter has shown a steady, gradual increase. 2026 EPS estimates remain largely flat, while 2027 estimates continue to move higher.
Historically, analysts have been relatively efficient at predicting these forward EPS; the direction is usually correct unless a recession is happening. This is not to be taken lightly. A recession could always happen, but I increasingly think that in an economy of high nominal growth pushed by fiscal dominance, the risk of a recession is extremely small. There is a big opportunity cost in sitting on the sidelines waiting for Godot.
This is consensus; I agree. Sentiment is (very) elevated, positioning is heavy, and valuations are stretched. But we are not living in normal times. A pullback will inevitably come along the way. Volatility is being suppressed by passive flows, retail traders’ mania buying every dip, and a president micromanaging the stock market. Volatility spikes will happen, whether from geopolitical events (Iran) or another technical blow-up in financial markets. All these are good reasons to own downside protection, but none of them are good reasons to stay uninvested. You will not survive this debasement world if you don’t adopt the debasement mindset and do not believe that this new economic regime is rewarding labor. No, not anymore. Another “K” for you:
The Fed’s reaction function will remain dovish because of this, independence from the White House or not. Forget all the nonsense we’ve heard in the last few days about Warsh, balance sheet reduction and hard money, etc. It’s noise.
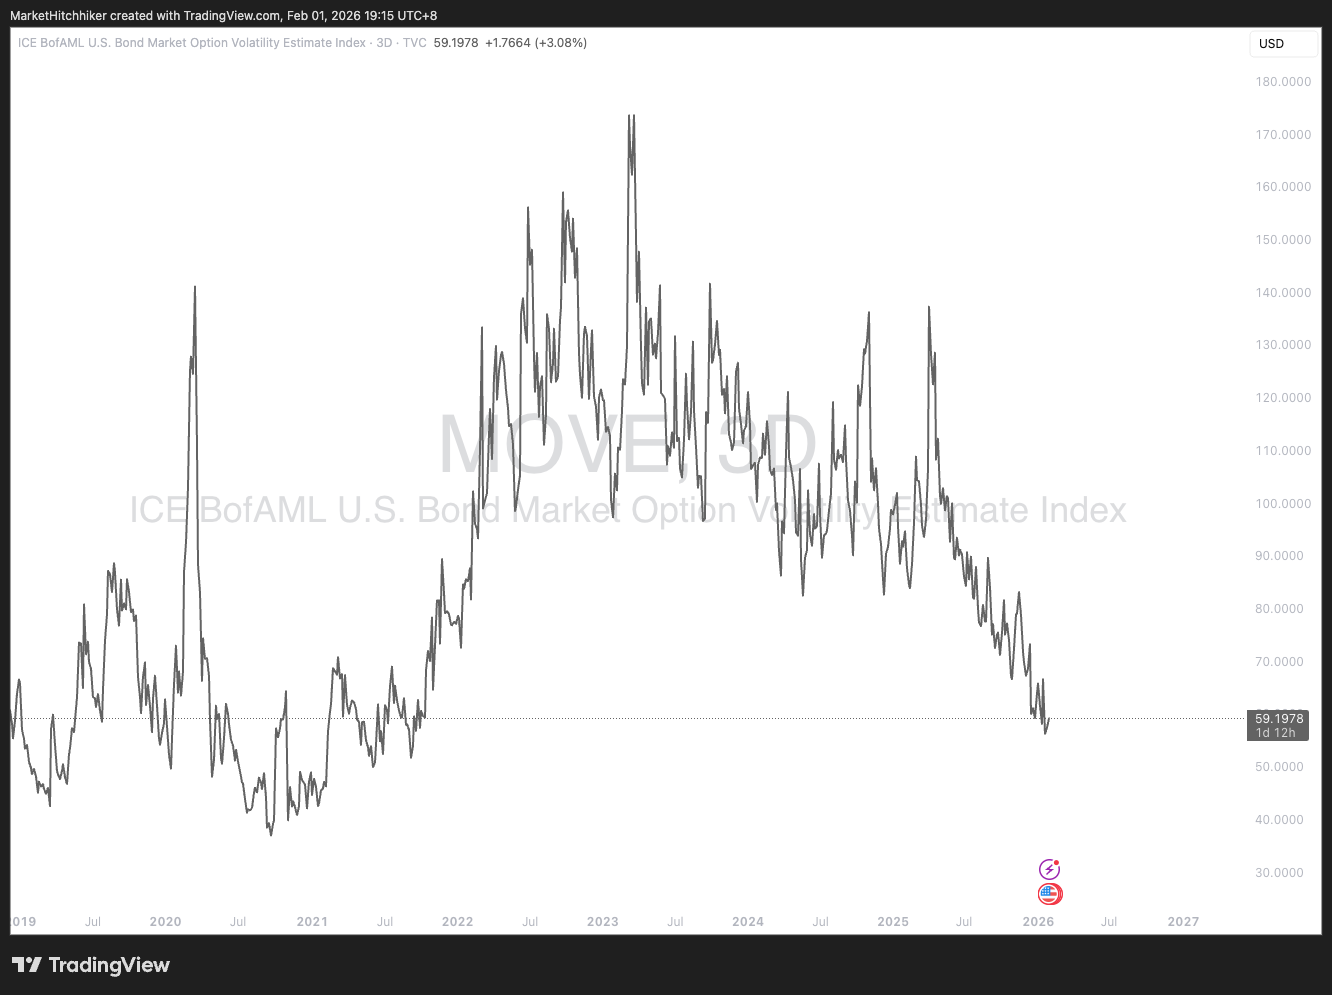
All indicators are pointing toward a steeper yield curve, pushed by an increasing term premium and a potential flare-up in inflation. The main source of risk for equities will be a redux of 2022: rising volatility in the bond market. It will happen eventually, but until then, we keep partying in that room where the clocks have no hands.
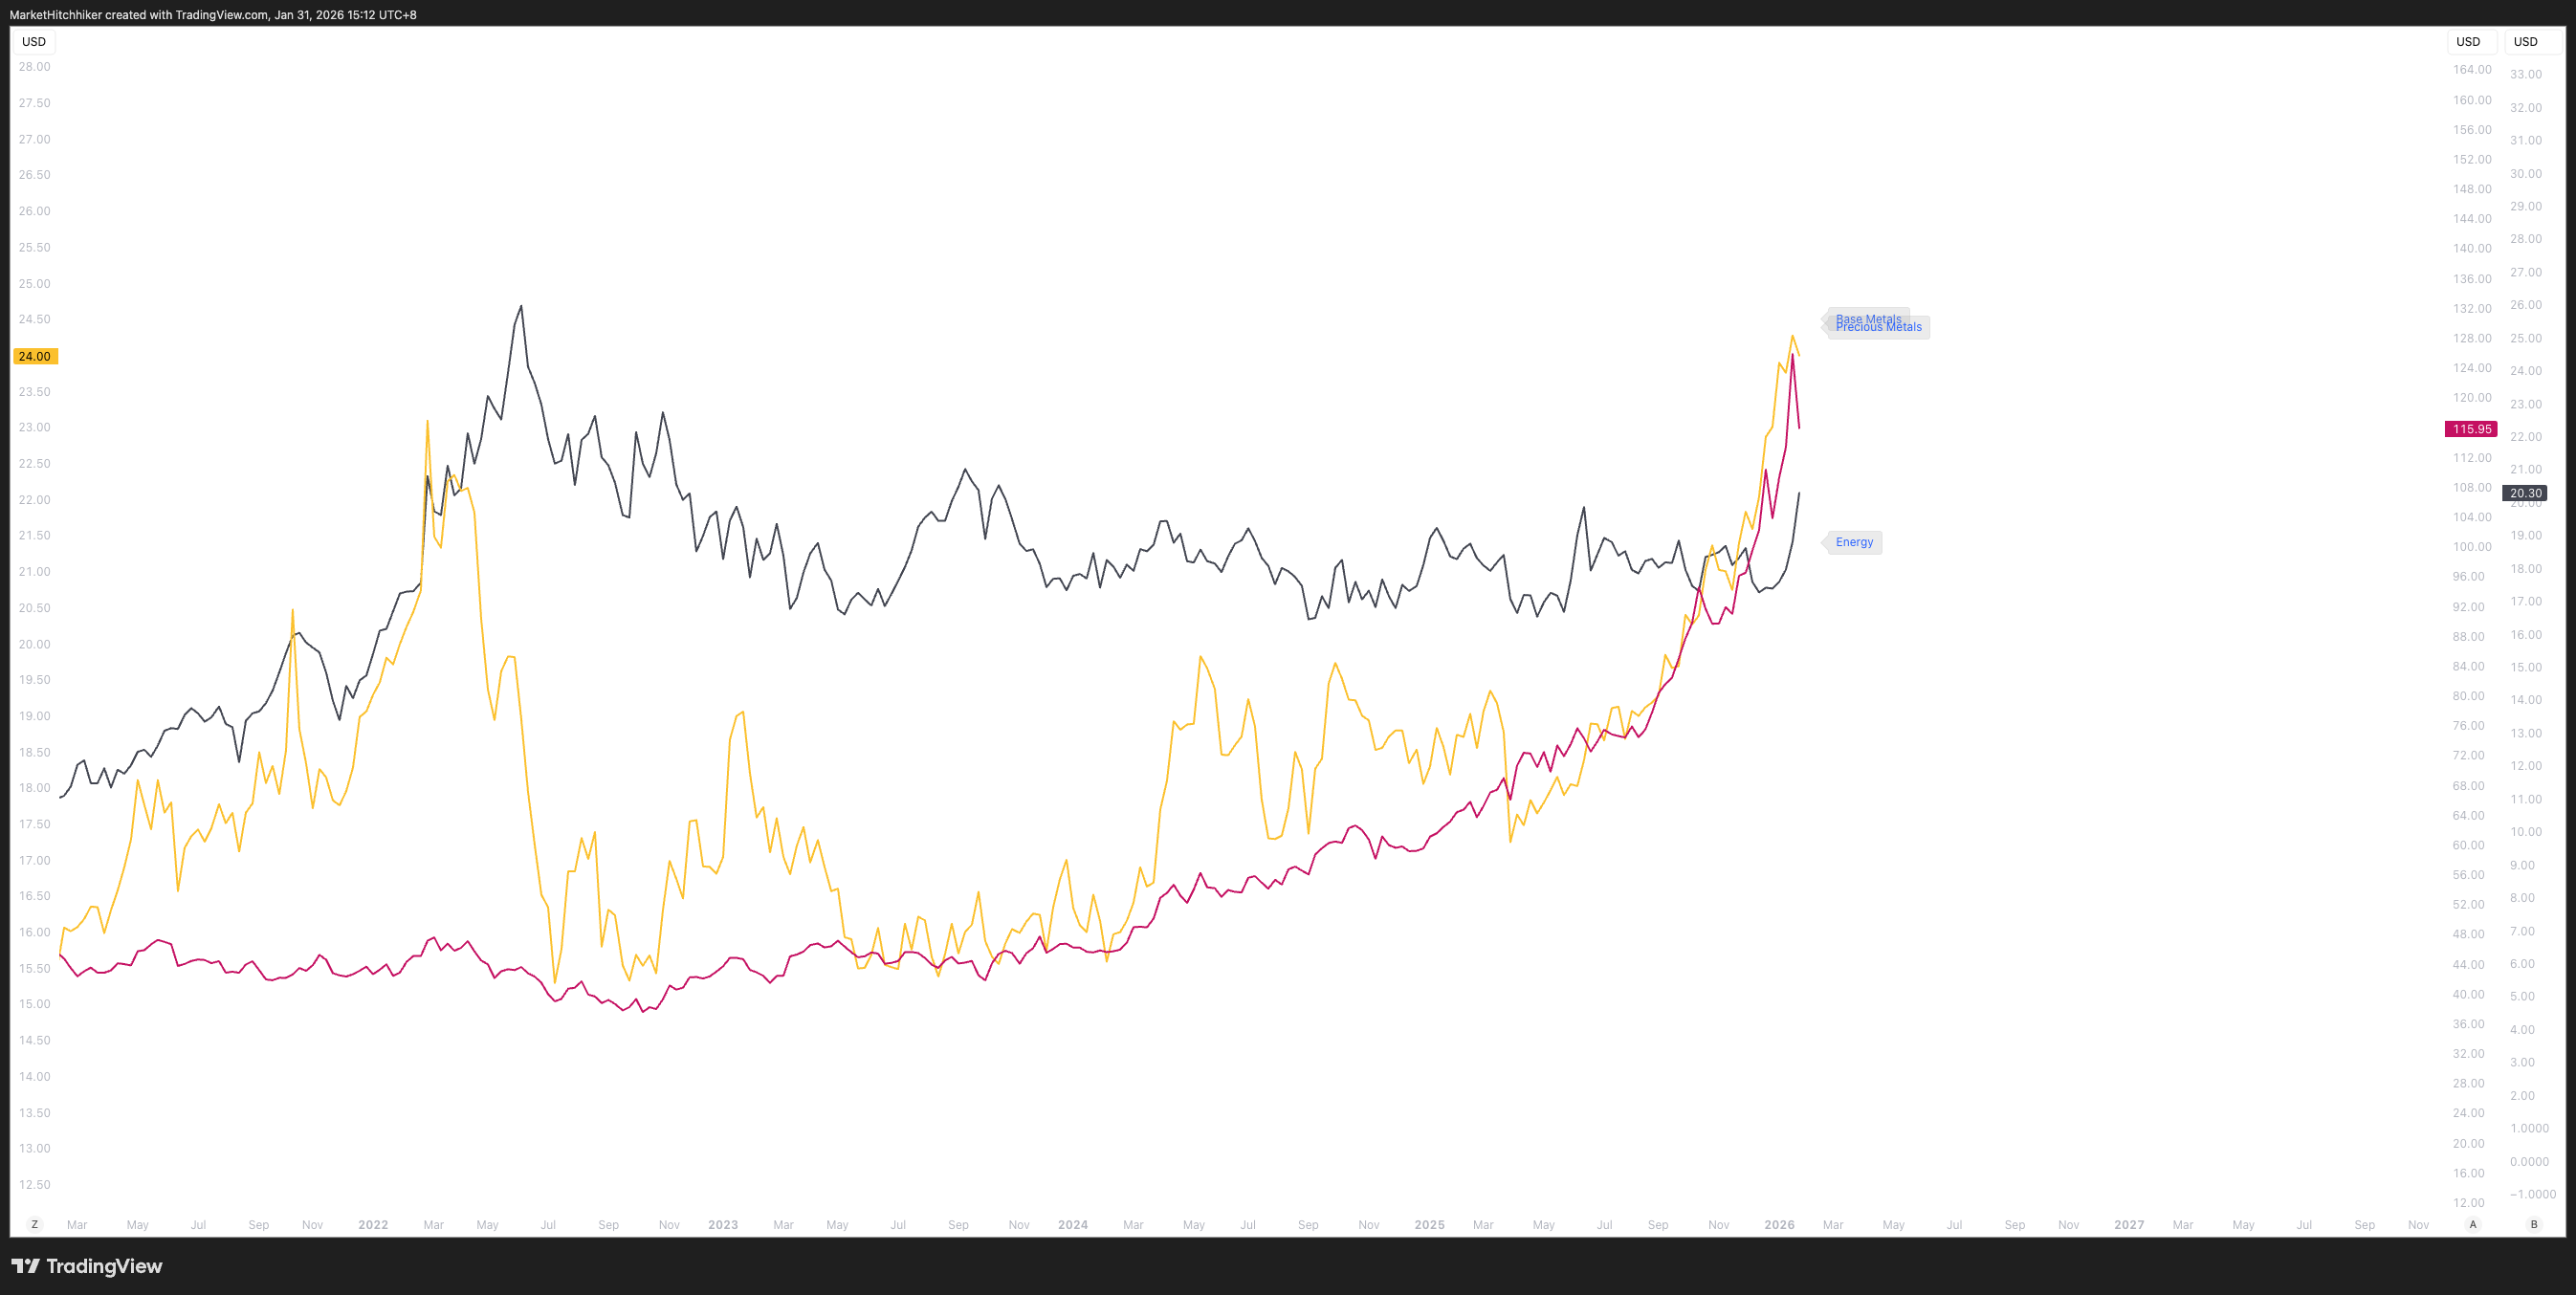
The beneficiaries of this eventual regime transition from Goldilocks to Reflation are equities and commodities. The craziness in precious metals gives me pause, but I don’t think there is any need to overcomplicate it: the trend is not broken, past supercycles have seen such sharp corrections, and the secular forces will work their way through the waves of liquidations and inevitable drawdowns.
A bearish steepener will not be kind to bonds. I am currently trading TLT from the short side; only an AI productivity miracle could save the back end of the yield curve. While I am very optimistic about AI capabilities in the future, I doubt it will tame the incoming inflation dragon. AI is an angry energy beast, and its appetite is only growing with time.
Trade accordingly.
Good luck,
~MH