
Performance review: Q1-2026
What trading for a living looks like in real life: my performance for Q1 2026 and since inception

It might feel painful, boring, and time-consuming, but there is simply no shortcut. Thoroughly journaling every trade and regularly reviewing your performance is the foundation of any consistently successful trading strategy.
Q1 2026 is now behind us. Let’s review the trades I shared with you over those three months. Every one of them was logged in real time through the web app and sent as an instant email notification to paid followers. Each notified trade was executed live in my own account.
I’ll also share the full performance of my trading account. It may differ slightly from the shared trades because I occasionally take additional positions that I don’t notify. I only send out my highest-conviction ideas. As you’ll see, I would have been far better off sticking strictly to those. My live results are already solid, but they could have been exceptional. I’m still working on becoming a better trader by ruthlessly following my own process and eliminating those avoidable mistakes.
Becoming the best is a lifelong pursuit. My goal is to keep aiming higher, course-correct quickly, and stop repeating the same errors.
Enough preamble. Let’s dive into the results.
1. Q1-2026 official trades result
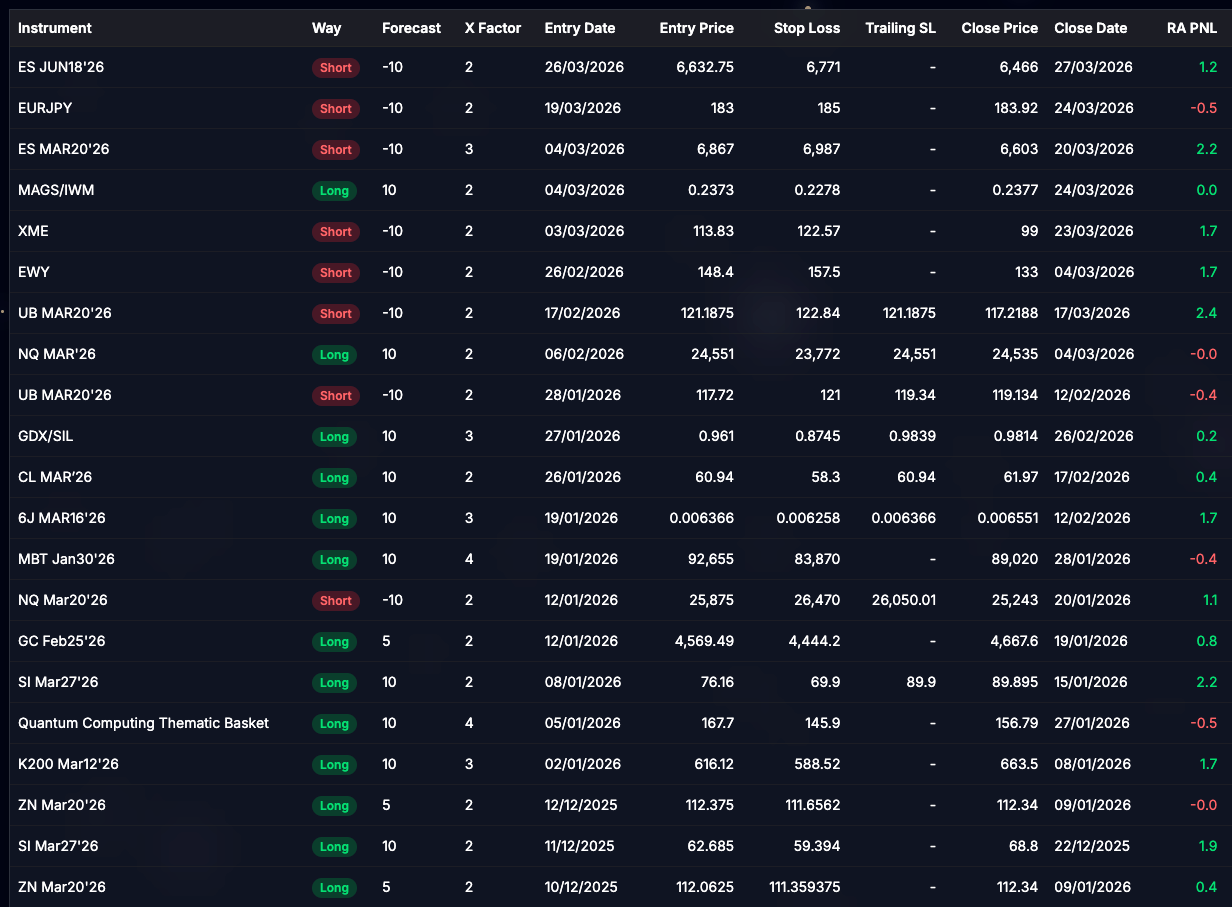
All the above trades have been closed during Q1 2026. If you are not yet comfortable with what the forecast and X-factor mean, you should definitely reread my guide about position sizing. This is by far the most important post I have written:
The Hitchhiker's Guide to Sizing

This guide is inspired by the risk management system introduced by Robert Carver in his book Systematic Trading. Despite its name, the book is also an excellent read for discretionary traders looking for systematic sizing. The Hitchhiker's Guide to the Market is a reader-supported publication. To receive new posts and support my work, consider becoming …
Risk-adjusted profit and loss, or RA PNL, is a metric that measures trading performance relative to the risk taken on each trade. Rather than looking solely at absolute monetary gains or losses, RA PNL expresses results in terms of multiples of the initial risk. This approach allows traders to evaluate how effectively they are managing their capital and whether their strategy truly has a positive expectancy over time.
At its core, RA PNL compares the actual profit or loss on a trade to the amount the trader was originally willing to risk, which is typically defined by the distance between the entry price and the stop-loss level. For instance, a result of +1.0 RA means the trade generated a profit exactly equal to the risked amount. A reading of +1.5 RA indicates the trader captured 1.5 times the initial risk, while a negative figure such as -0.5 RA shows that the position was closed at a loss equal to only half of the predetermined risk. This normalization makes it possible to compare trades across different instruments, position sizes, and timeframes on an equal footing.
To illustrate with an example from my own trading, consider one of my trades in the ES JUN18’26 contract. I entered a short position at 6632.75 with a stop-loss at 6771, establishing a risk of 138.25 points. The trade was later exited at 6466, producing a profit of 166.75 points. This translated to an RA PNL of +1.2, meaning I captured 1.2 times the amount I had initially risked.
For novice traders especially, tracking RA PNL offers several important advantages. It shifts the focus from raw dollar amounts or price points to the quality of risk management. By emphasizing how tightly losses are controlled and how well winners are allowed to develop, it provides clearer insight into the true edge of a trading approach. Over a series of trades, the average RA PNL becomes a powerful indicator of whether the strategy is profitable in risk-adjusted terms.
I’m excited to report that I have delivered a total +17.80 RA PnL. This is top-tier performance.
Key statistics:
Total RA PNL: +17.80 ✅ (excellent)
Trades: 21
Win Rate: 66.7% (14 wins, 4 losses, 3 breakeven)
Avg RA PNL per trade: +0.85R
Avg Win: +1.40R
Avg Loss: –0.45R ← this is the standout (I’ve been cutting losers very well)
Avg holding time: 16.2 days (range 1–30 days) ← much shorter than I would have expected. I picture myself as a macro trader, but I’m in fact living in the short term end of the macro trader spectrum.
Longs (13 trades): +0.65R avg, 61.5% win rate
Shorts (8 trades): +1.18R avg, 75% win rate ← shorts were my edge this quarter
While these results are great, I still have some regrets on three trades, specifically on silver and KOSPI. I haven’t pushed these winners enough. When momentum is this strong, with very high retail participation, I should have kept riding these trades with a trailing stop loss. Instead, I took profits while the moves were strong. I didn’t wait for my trailing stop to be breached. This probably cost me close to 10 RA!
To put things in perspective, if you follow my sizing process for a portfolio with a 25% target volatility and an average of four positions, each trade risks around 0.78% of your trading account using a standard forecast of +/- 10 and an X-factor of 2. For Q1, with a total RA PnL of +17.80, this translates to a return of 17.80 x 0.78% = 13.88%. Not bad for a 25% annualized target volatility (!). Obviously, here we are only talking about absolute returns as of today. We are not looking at path-dependent variables like drawdown, realized volatility, Sortino ratio, etc. In the following section, my live trading account on Interactive Brokers provides these statistics.
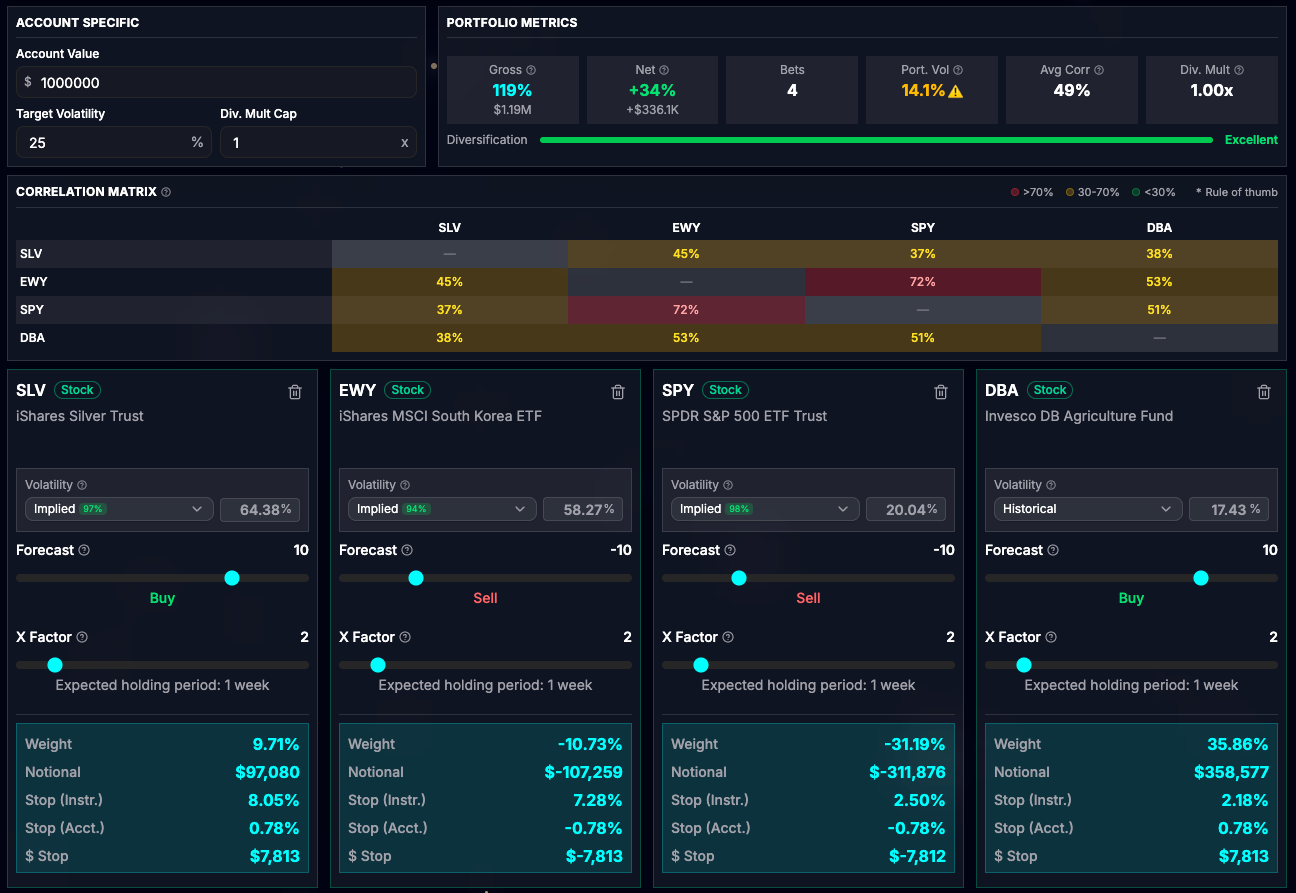
The above screen is the sizing tool available at app.markethitchhiker.com
2. Q1-2026 live trading account result
As explained before, all the trades from the app have been traded live. I also traded a few extra unofficial trades, which were mostly flat to negative overall. The nasty drawdown in February was my own making: I f*cked around with some ill-timed Bitcoin positions and short-term options on SPX… Not a great look. Fortunately, I offset most of these bad trades during the Iran war blowout.
I eat what I hunt. This trading account is my only source of income. I’m all in on the Game. Full commitment or nothing.
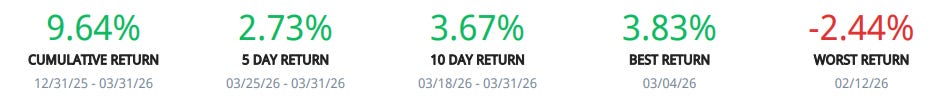
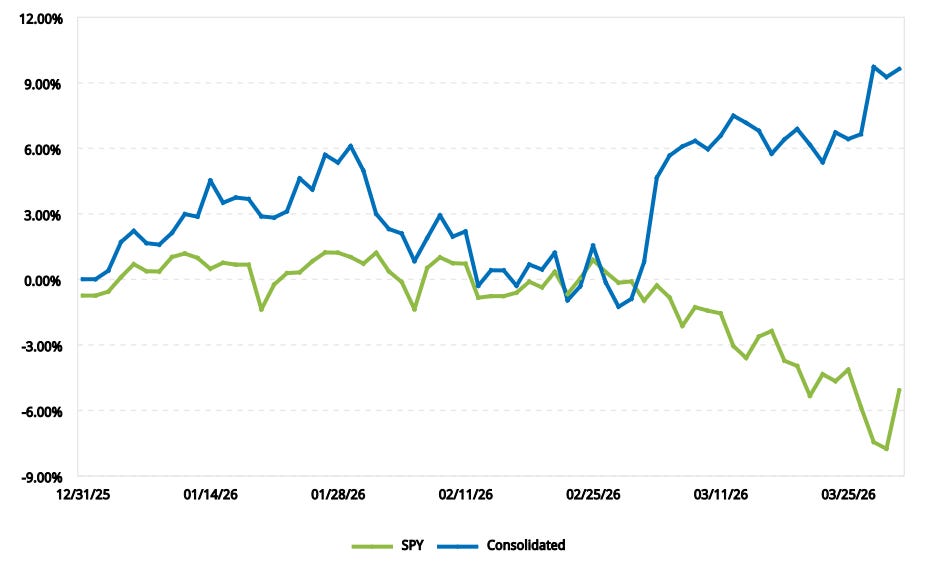
Here are the results from Q1, Consolidate (blue line) is my trading account:
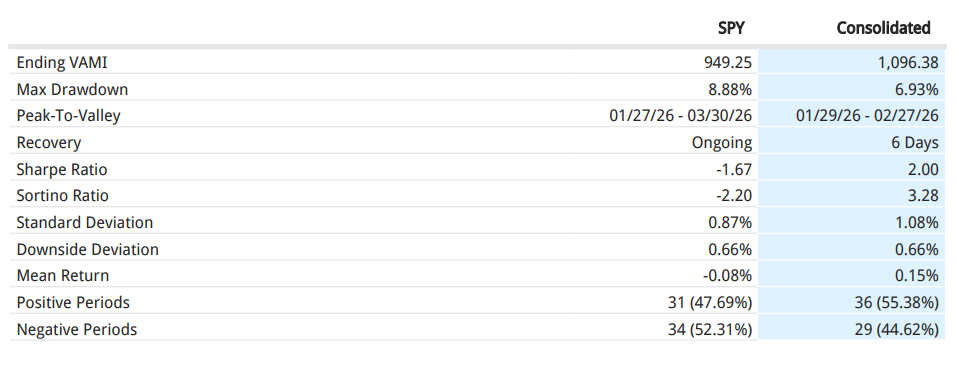
The good:
A 9.64% return while my realized annualized volatility is 17% is very good. The equivalent quarterly volatility is 8.5%, so my Sharpe ratio is ~1.15. The IB report shows 2.00, which is probably annualized (?), not sure.
Standard deviation is 1.08% while downside deviation is 0.66%. That’s great news. I am not running a short-convexity strategy. I thrive in volatility.
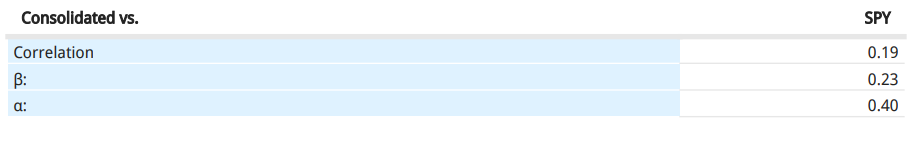
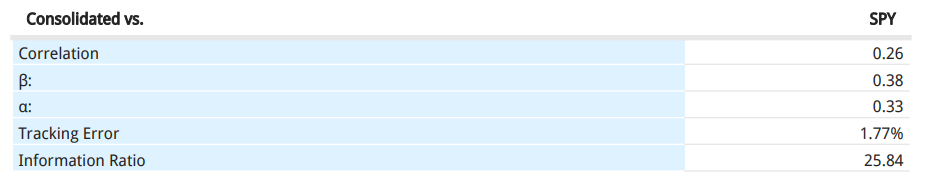
Beta to the S&P 500 is only 0.23, and alpha is much higher at 0.40.
The bad:
A 6.93% drawdown for a 9.64% return is below my expectations in terms of risk/reward profile. It happened because I fumbled a bit with my process and took some unnecessary trades. My biggest weakness is my tendency to overtrade. It kills returns.
Overall, this has been a good Q1, but it could have been an outstanding one. The February drawdown was my own making. Lesson learned: don’t overtrade and stick to your high-conviction trades.
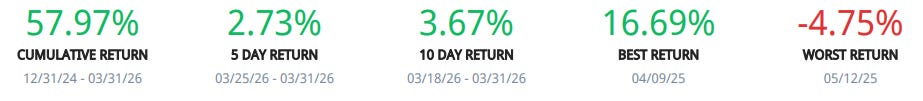
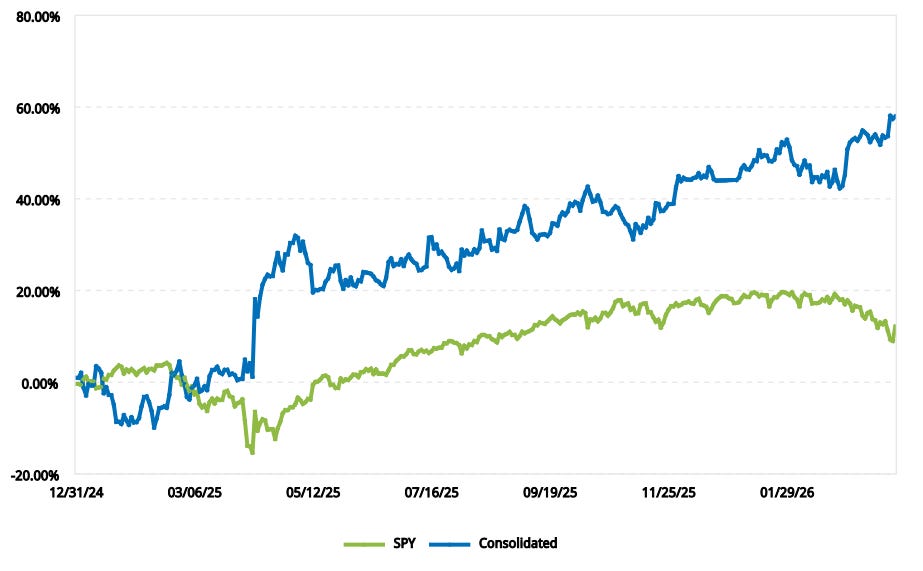
3. Live trading account result since inception
Below is my cumulative performance since I started this Substack in December 2024. Trump has been a great source of volatility, and it matches my style perfectly. MAKE MACRO GREAT AGAIN!
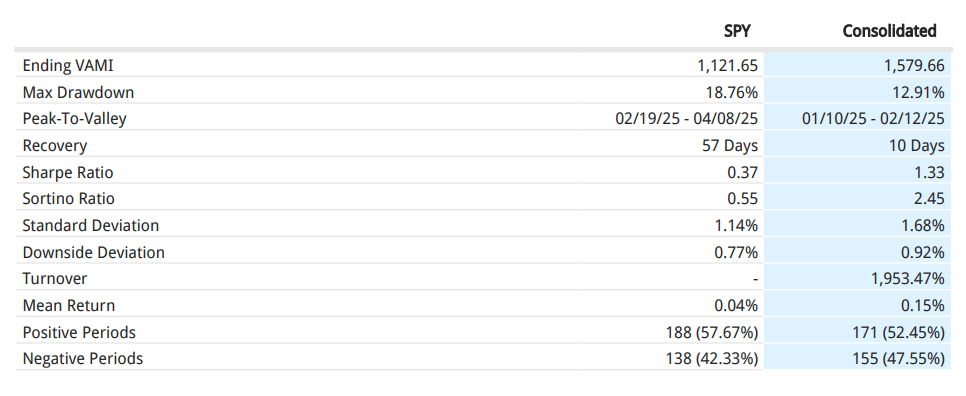
Could you manage my portfolio?
Great performance thanks to your rigorous work ethic. Solid breakaway during liberation day and early march. Well done!